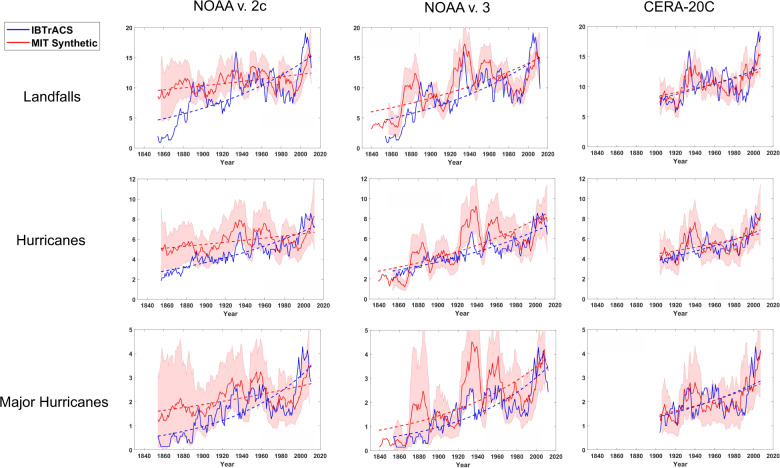
Fig. 1. Time series of North Atlantic landfall events, basin hurricanes, and major hurricanes.
The landfall frequency (top row) includes only storms whose lifetime maximum winds speeds exceed 40 kts (21 ms−1). Middle row shows basin frequencies and bottom row shows basin-wide major hurricane frequency. Red curves show quantities associated with tropical cyclones downscaled from three global climate reanalyses (left to right) and blue curves are derived from uncorrected historical tropical cyclone (IBTrACS) data. All quantities have been smoothed with a 7-year running mean. The downscaled counts have been multiplicatively rescaled to match the mean of the last 50 years of the historical data. The dashed curves show the Poisson regressions of the downscaled and historical data. The shading around the downscaled counts shows the bounds within which 90% of subsamples of the downscaled data lie, with the subsample size equal to the historical counts.

