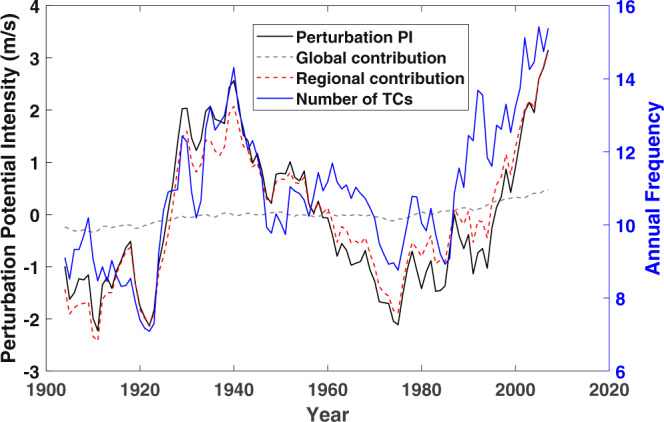
Fig. 4. Comparison of Atlantic tropical cyclone frequency to potential intensity anomaly and decomposition of potential intensity into global and regional contributions.

Seven-year running means of Atlantic Main Development region (6°–18° N, 20°–60° W) August–October departures of potential intensity (black, ms−1) from its mean over the record, and its decomposition into global (dashed green) and regional (dashed red) components. The 7-year running mean of the annual frequency of tropical cyclones downscaled from CERA-20C is shown in blue (right axis).
