
Fig. 1 |. scRNA-seq reveals major cell populations in the NAc.
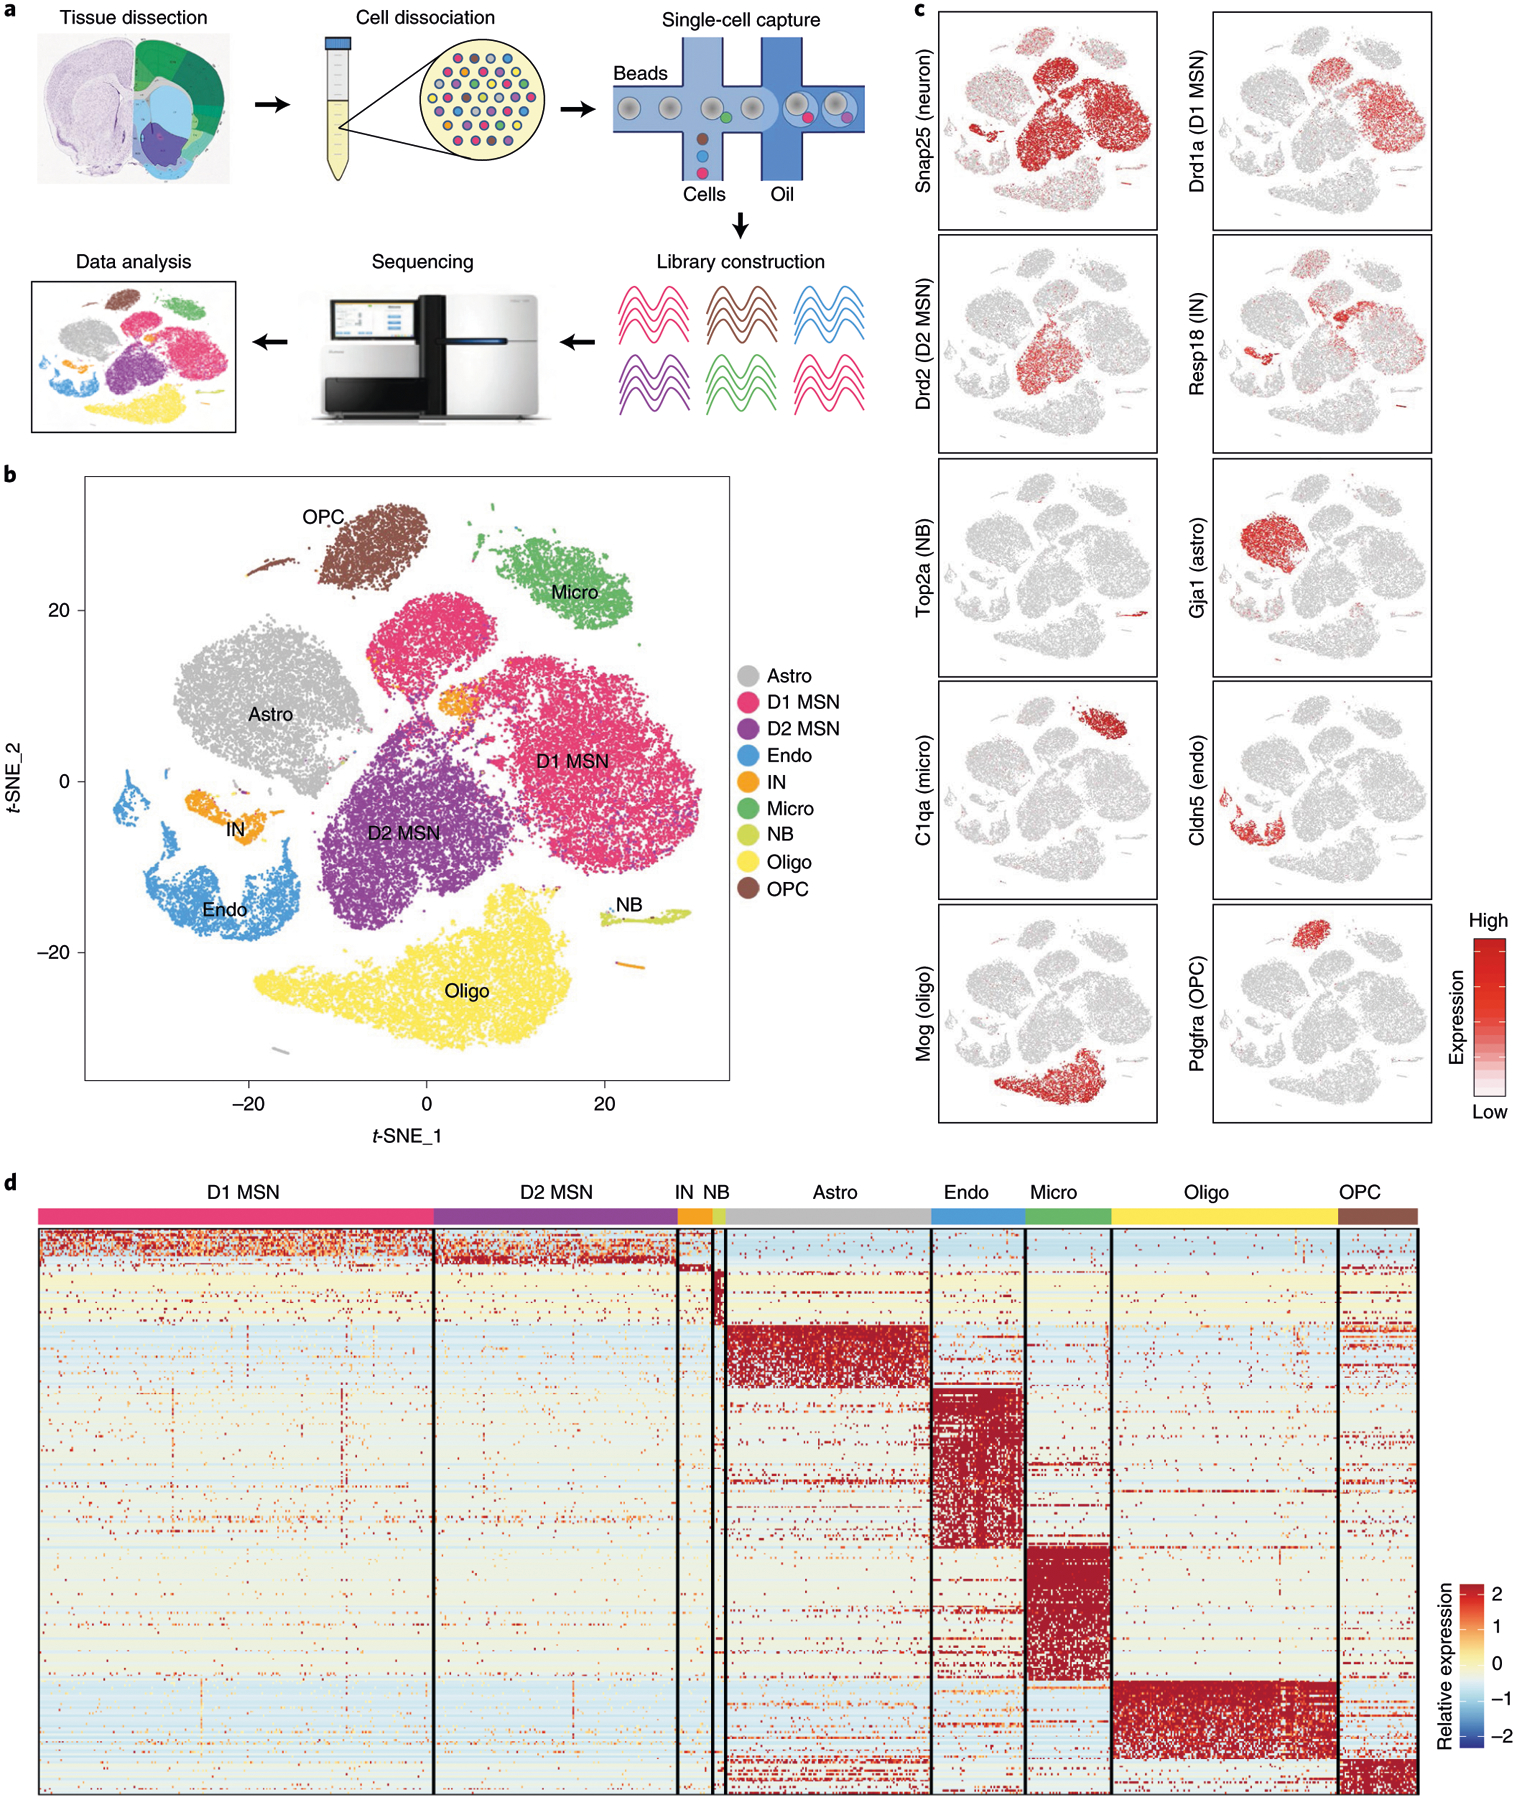
a, Workflow of scRNA-seq of mouse NAc. NAc tissues were dissected from adult mouse brain and dissociated into single-cell suspension. Single cells were captured into droplets with the 10x platform, followed by cDNA synthesis, amplification and library construction. After sequencing, cells were classified by their transcriptomes. b, t-SNE plot showing the different major cell types in the NAc. Different cell clusters are color-coded. c, t-SNE plots showing expression of cell-type-specific markers across different cell subtypes. The gene expression level is color-coded. d, Heat map showing that the cell-type-specific markers are differentially expressed across the nine NAc cell populations. DEGs with power >0.4 and fold change >2 among the nine cell clusters were used to generate the heat map. Columns represent individual cells, and rows represent individual genes. The gene expression level is color-coded. Astro, astrocyte; Endo, endothelial cell; Micro, microglia; NB, neural stem cells and neuroblasts; Oligo, oligodendrocyte; t-SNE, t-distributed stochastic neighbor embedding.