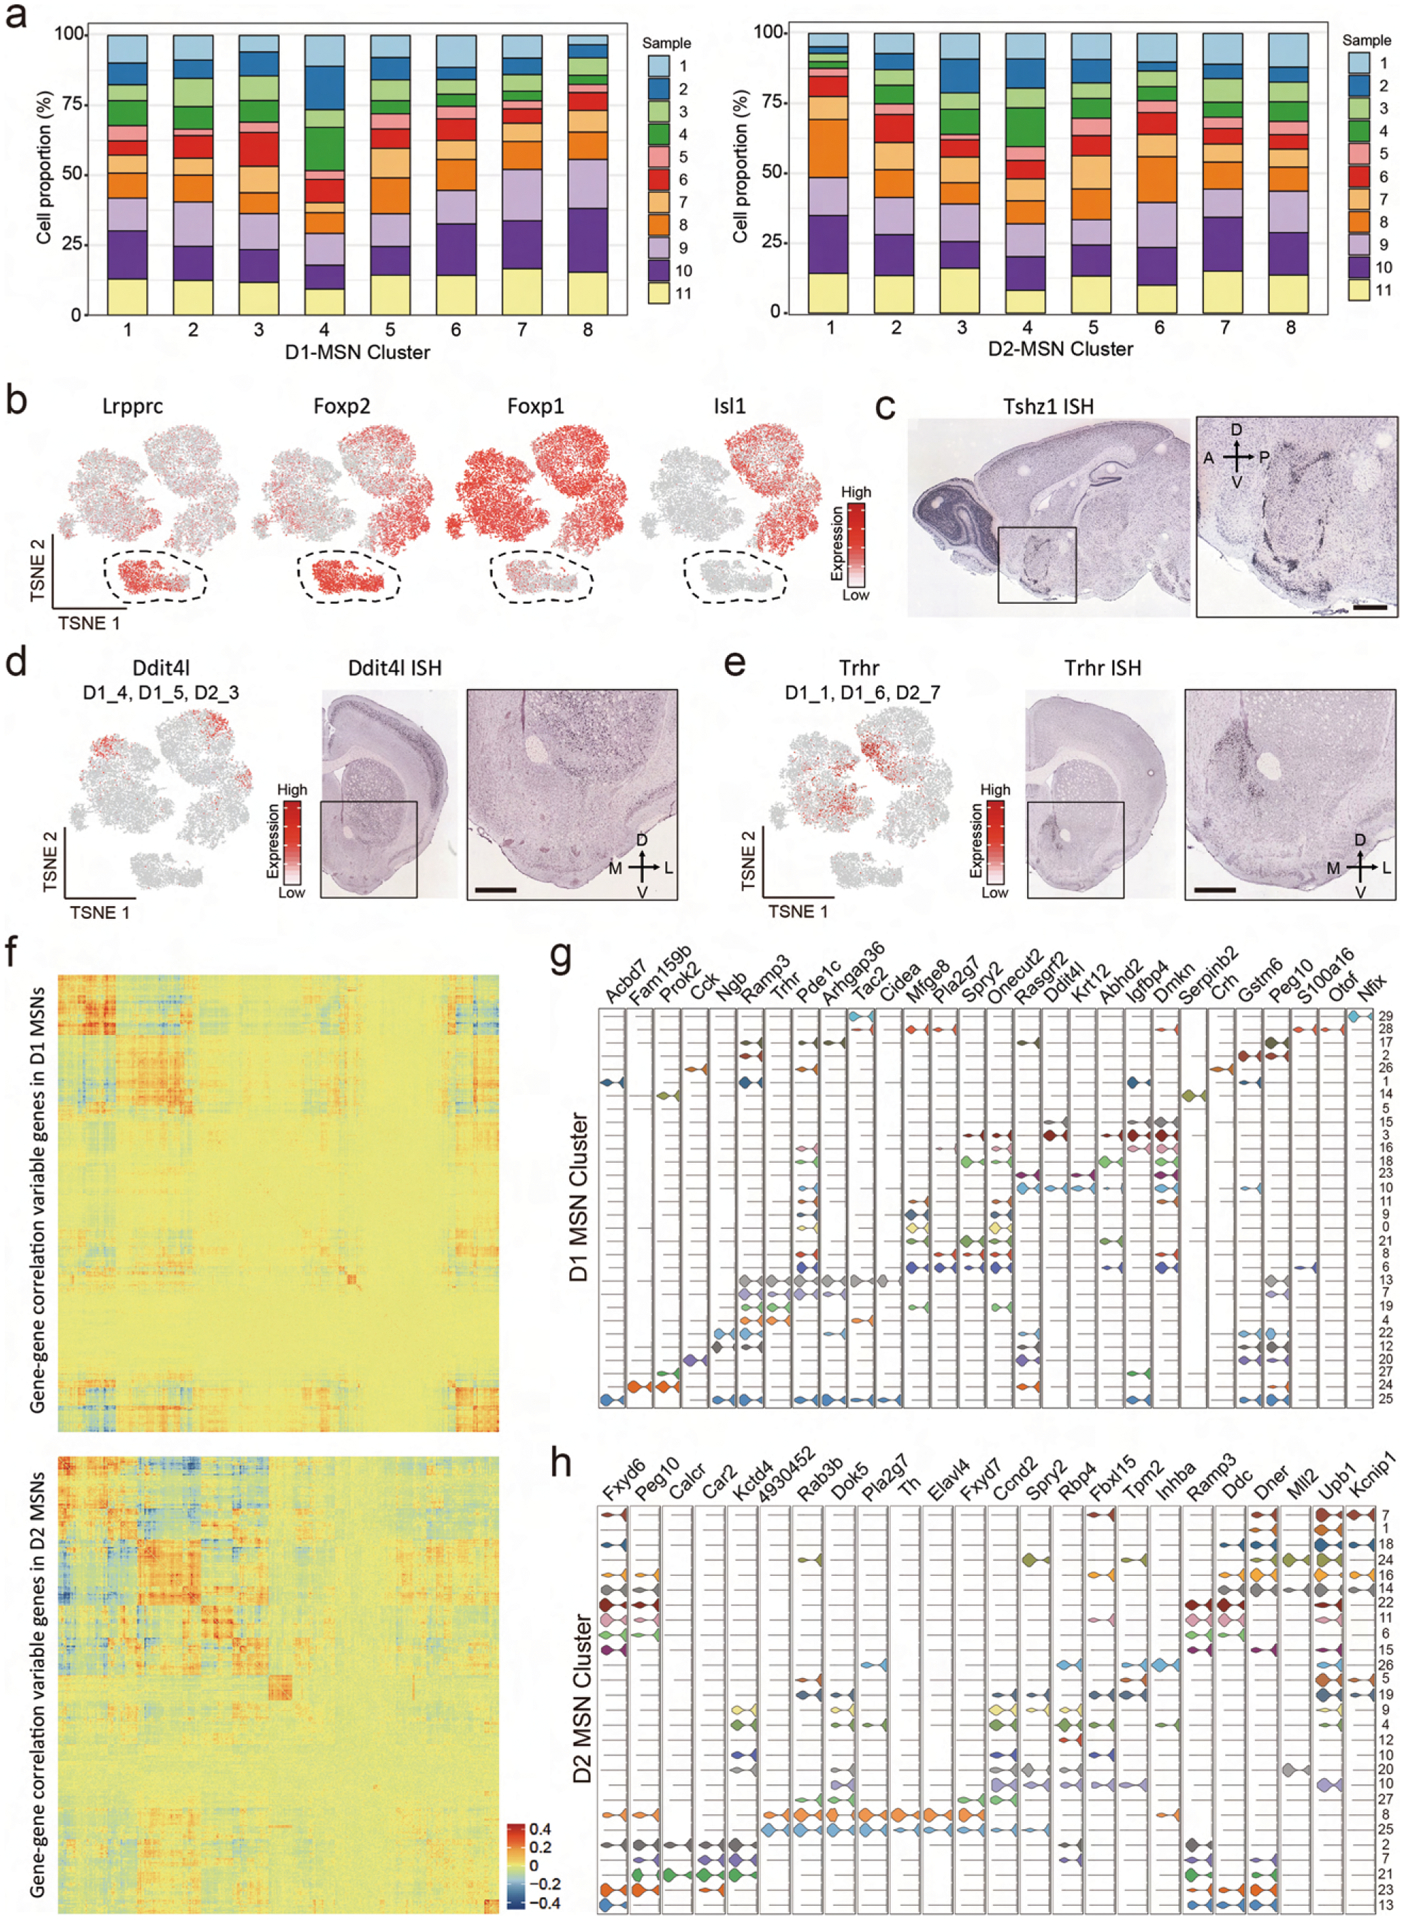
Extended Data Fig. 3 |. Molecularly defined MsN subtypes exhibit distinct spatial distribution in NAc.

a, Histograms showing the percentage of cells from each of the 11 samples across D1 and D2 MSN subtypes. Different samples are represented in different colors. b, tSNE plots showing the expression pattern of Lrpprc, Foxp2, Foxp1 and Isl1 across MSN populations. The expression level is color-coded. c, ISH of Tshz1 showing the distribution of Tshz1+ cells in NAc. Sagittal section of mouse brain including NAc is shown. The boxed region is enlarged and shown on the right. Data are obtained from Allen Mouse Brain Atlas. Scale bars, 500 μm. d, e, Ddit4l (d) and Trhr (e) are enriched in subpopulation of MSNs. Left panel, tSNE plots showing the expression pattern of Ddit4l (d) and Trhr (e) across MSN populations. The expression level is color-coded. The MSN subtypes labeled by Ddit4l or Trhr were indicated. Right panels, ISH image showing the distribution of Ddit4l+ (d) and Trhr+ (e) cells in NAc. The boxed regions are enlarged and shown on the right. Data is obtained from Allen Mouse Brain Atlas. Scale bar, 500 μm. f, Heatmaps showing the gene expression correlation of differentially expresses genes in D1 MSNs (upper panel) and D2 MSNs (lower panel). The correlation is color-coded, and genes were sorted into groups with higher intra-group correlation. g, h, Violin plots showing the expression of selected markers across high-resolution D1 (g) and D2 (h) MSN subtypes. Different MSN subtypes are color-coded. The mRNA level is presented on a log scale and adjusted for different genes.
