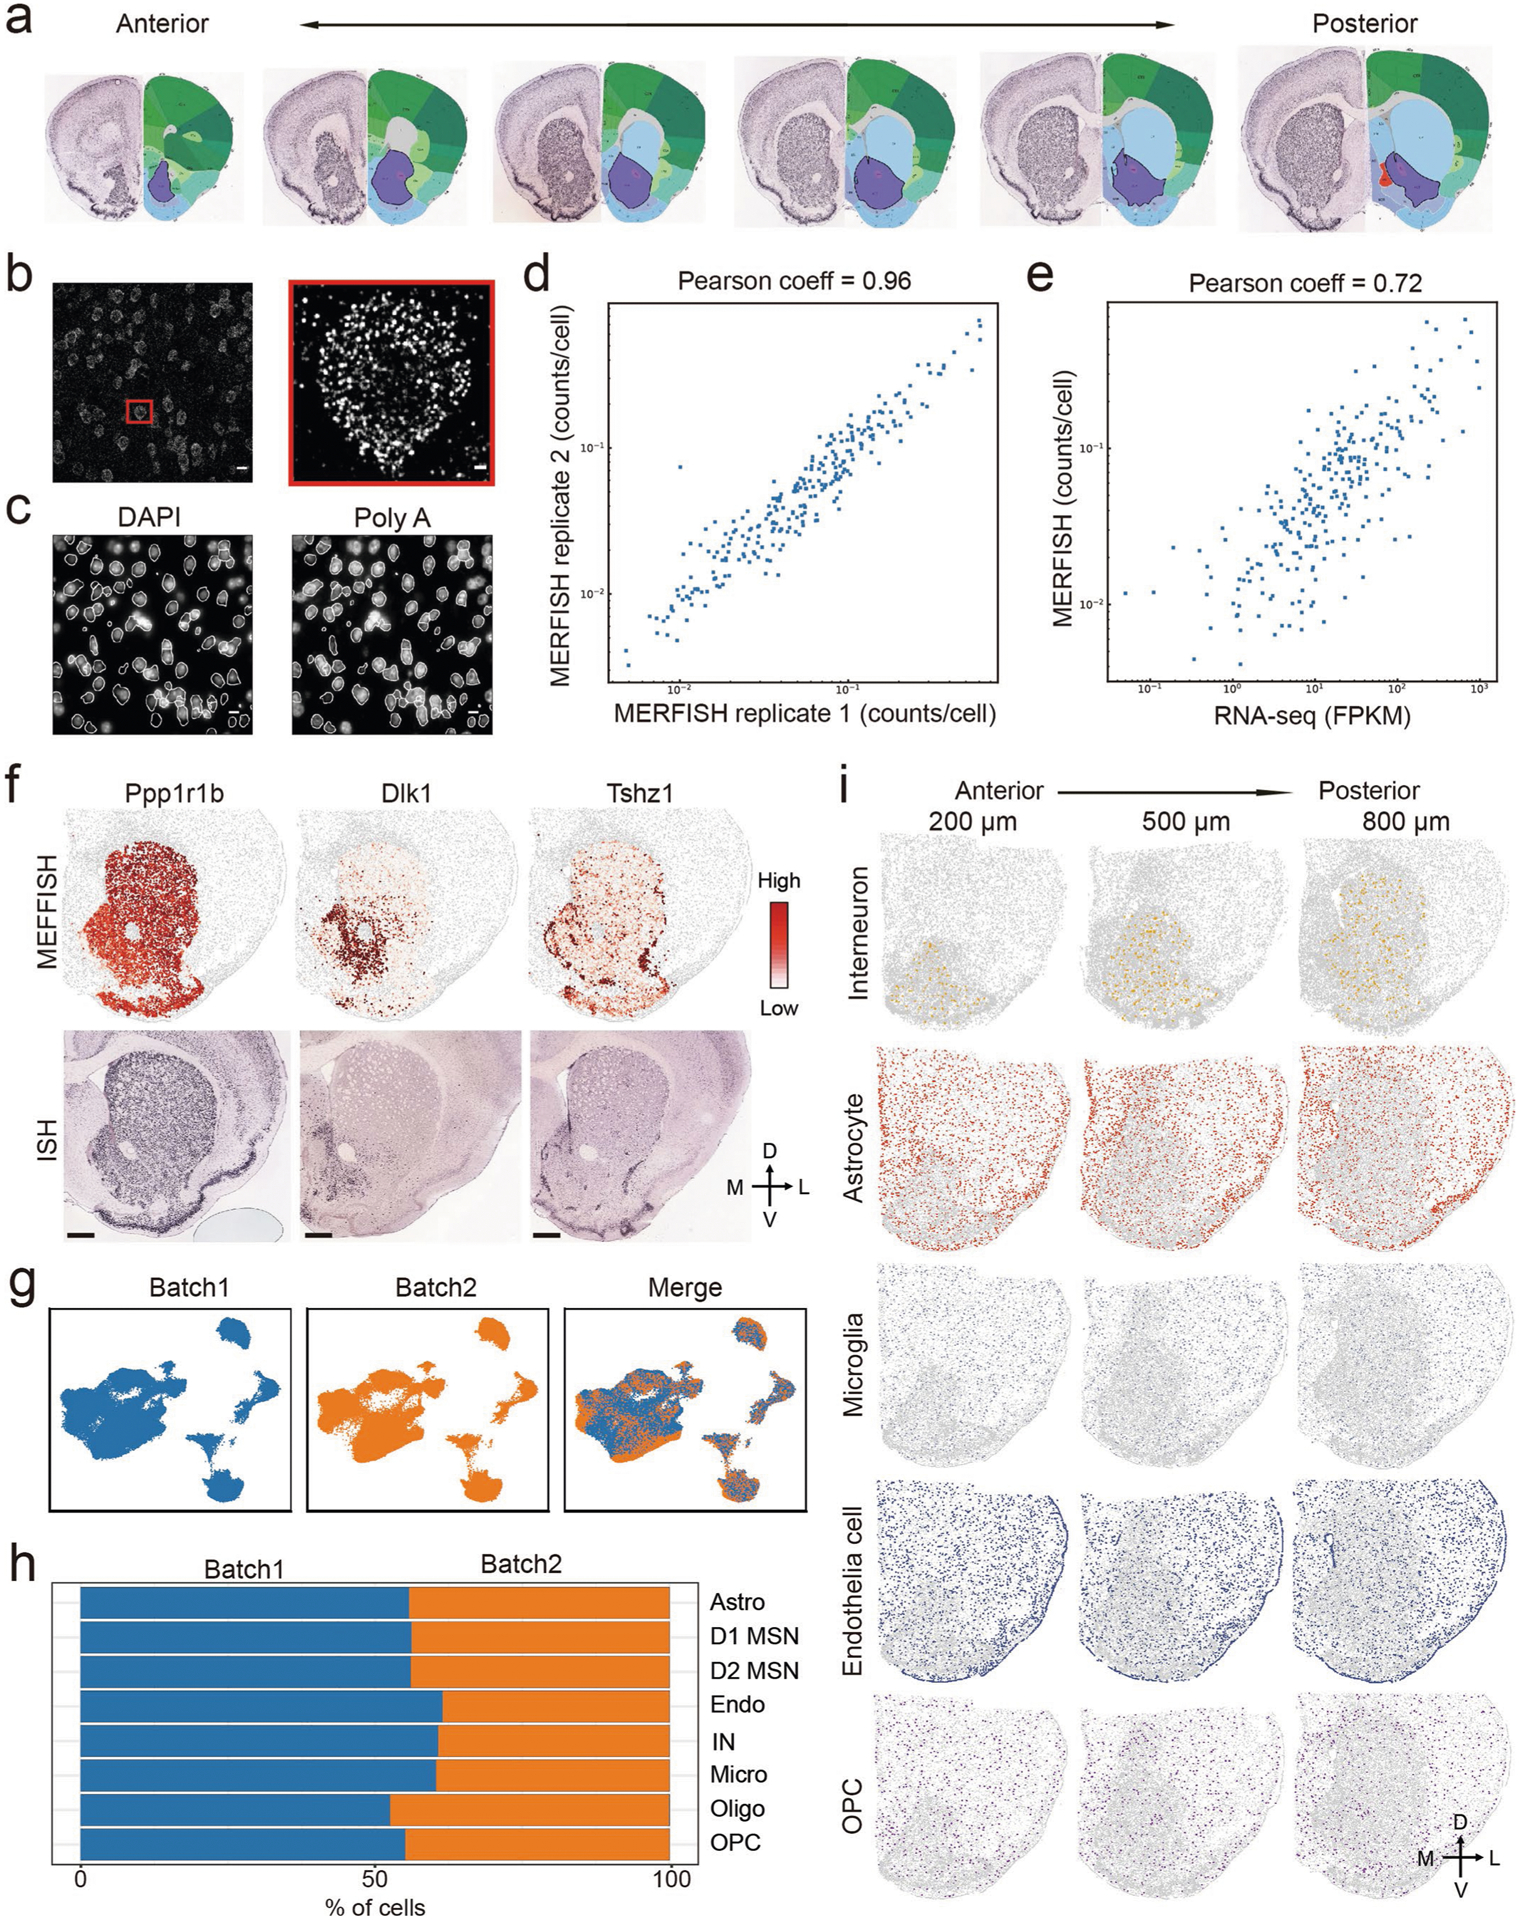
Extended Data Fig. 4 |. MERFISH revealed major cell types in striatum.

a, Schematic diagram showing the striatal slices used for MERFISH. Adult mouse brain was first cut into 10 μm -thick serial coronal sections. Twelve brain slices with 100 μm interval between adjacent slices were used for MERFISH experiment. The brain pictures were taken from Allen Mouse Brain Atlas, note that only 6 slices were shown. b, One example image showing the maximum projection of images taken in one representative field-of-view (FOV) during MERFISH. The boxed region was enlarged and shown on the right. Individual RNA molecules were detected as single dots. c, DAPI (left) and poly(A) RNA (right) images were used to define the boundaries of each cell in white. The mRNA molecules detected were assigned to different cells based on the cell boundaries. d, Scatterplot showing the average counts of each genes per cell detected by MERFISH in the two biological replicates. e, Scatterplot showing the average copy number of each genes per cell detected by MERFISH and bulk RNA-seq. The Pearson correlation coefficient is 0.72. f, Heatmap showing the expression pattern of selected genes in striatum as determined by MERFISH (upper panels), which are highly similar to the patterns determined by conventional ISH (lower panels). The ISH data are obtained from Allen Mouse Brain Atlas. Scale bars, 500 μm. g, the Harmony algorithm69 based UMAP plots showing the cells from the two replicates of MERFISH experiments with good overlap. h, Bar graph showing the proportion of major cell types from the two batches of MERFISH experiments after the Harmony integration. i, Spatial pattern of interneuron, astrocyte, microglia, endothelial cell and OPC in coronal brain sections at different anterior-posterior positions. Three of the twelve slices from a male mouse were shown. Colored dots were cells belong to the specified cell populations, while gray dots indicate all other cells. The 200, 500 and 800 μm labels indicate the distance from the anterior position (Bregma 1.94 mm). The dorsal-ventral (DV) and medial-lateral (ML) axes are indicated.
