
Extended Data Fig. 5 |. MERFISH identifies molecularly distinct D1 and D2 MsN subtypes in striatum.
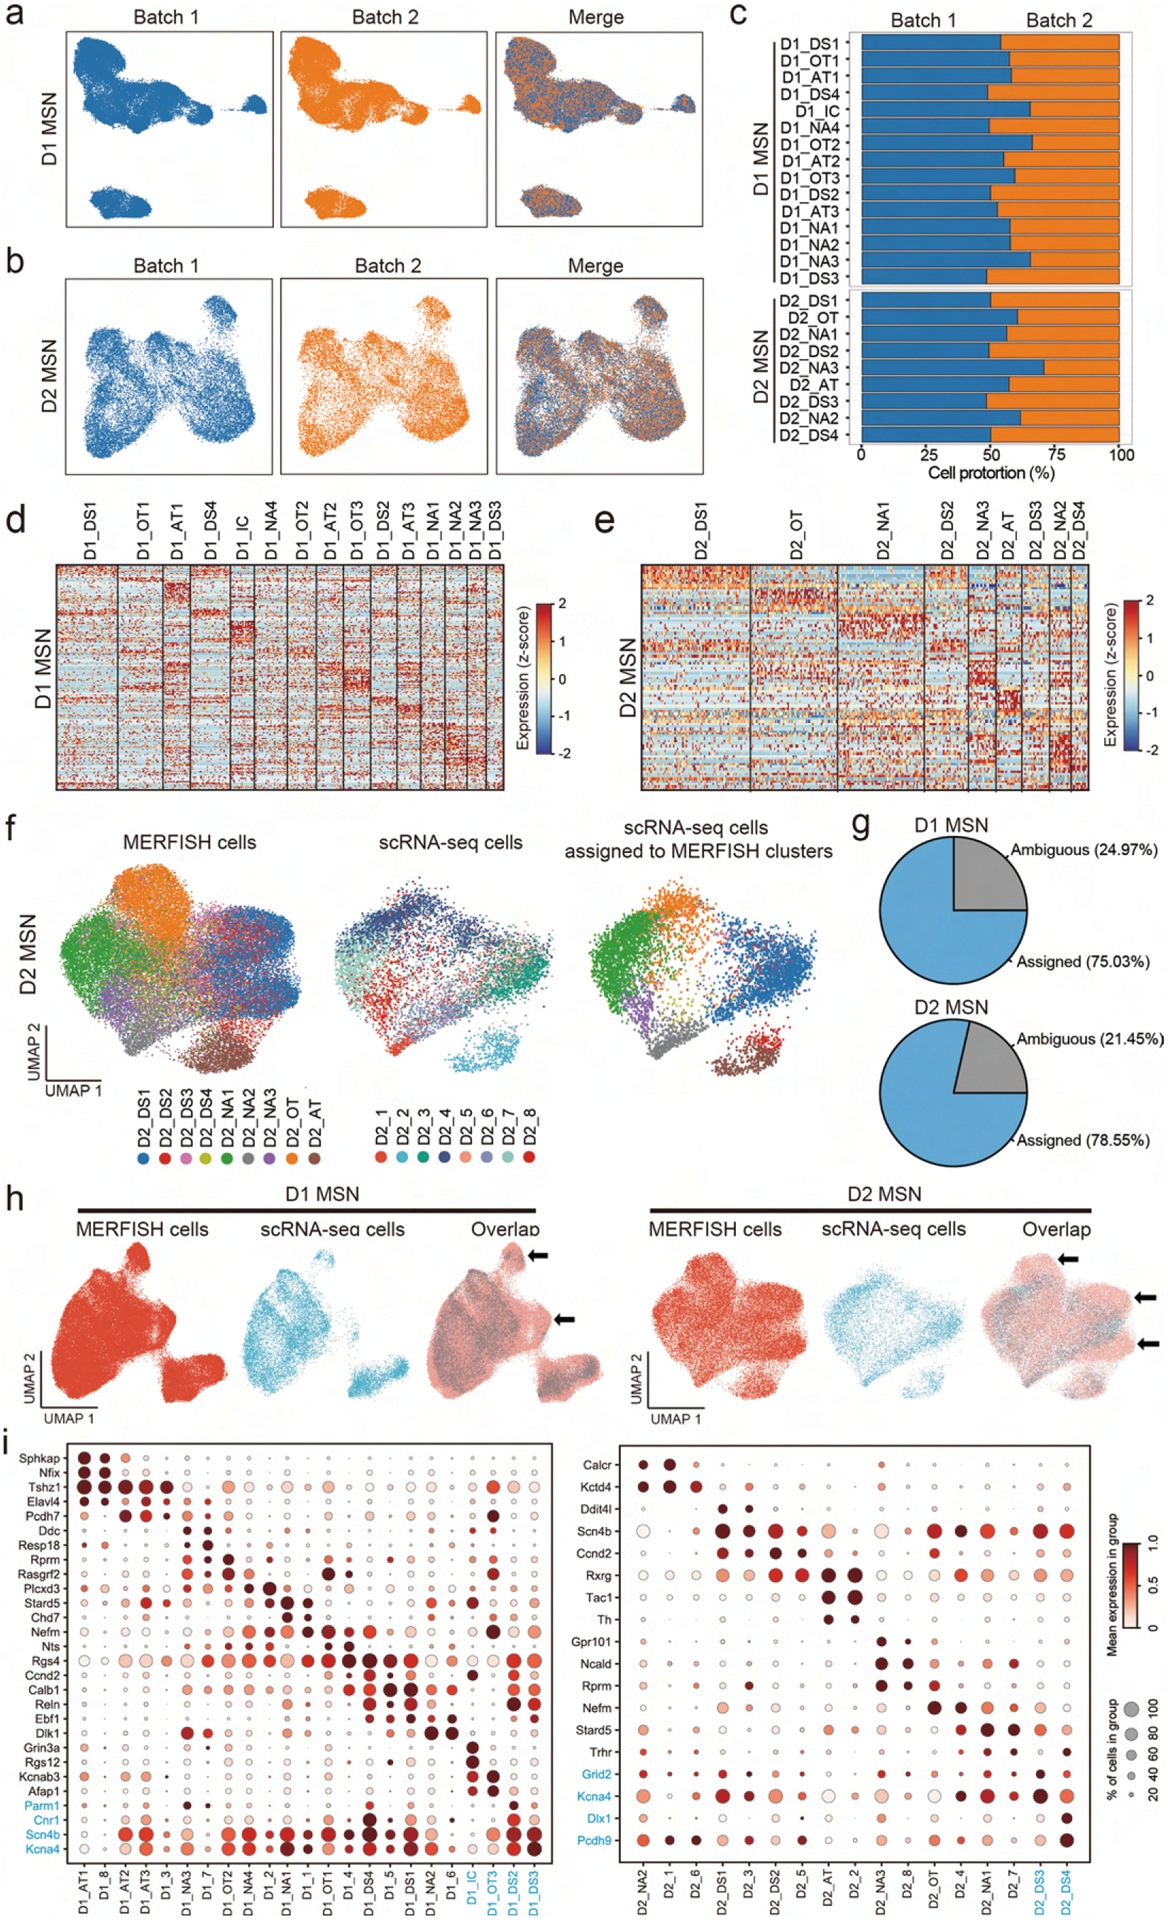
a, b, The Harmony algorithm69 based UMAP plots showing the D1 MSNs (a) and D2 MSNs (b) from the two replicates of MERFISH experiments. c, Bar graph showing the proportion of different D1 and D2 MSN subtypes from the two replicates of MERFISH experiments. d, e, Heatmaps showing the expression pattern of differentially expressed genes detected by MERFISH across D1 (d) and D2 (e) MSN subtypes. The expression level is color coded. The width of each column represents the abundance of each MSN subtype. f, Integrative analysis (Using the Harmony algorithm) of D2 MSNs from MERFISH and scRNA-seq experiments. The D2 MSNs from MERFISH and scRNA-seq experiments were integrated into the same UMAP space. The initial identity of each cell was color coded and shown in the left and middle panels. Based on the nearest neighbors from the MERFISH experiments, the cells from scRNA-seq were assigned to one of the MERFISH D2 MSN subtypes shown on the right panel. g, Pie charts showing the percentage of D1 (upper) and D2 (lower) MSNs from scRNA-seq experiments which could or could not be assigned to a certain MEFFISH identify due to insufficient MERFISH k-NN belonging to the same cluster. h, The Harmony algorithm based UMAP showing the D1 MSNs (upper panels) and D2 MSNs (lower panels) from scRNA-seq and MERFISH experiments. The cells from different experiments were integrated into the same UMAP spaces. The arrows indicated UMAP spaces that are mainly occupied by cells from non-NAc region, thus the scRNA-seq cells were depleted comparing to MERFISH cells. i, Dotplots showing the expression of selected MSN subtype markers in D1 (left) and D2 (ringht) MSN subtypes defined by MERFISH and scRNA-seq. The expression level is color-coded (MERFISH and scRNA-seq data are normalized and scaled separately). Dot size represents the fraction of cells expressing the gene in each subtype. Corresponding MERFISH and scRNA-seq clusters are grouped together. The names and marker genes of MSN subtypes identified by MERFISH but without corresponding scRNA-seq subtypes are marked in blue.