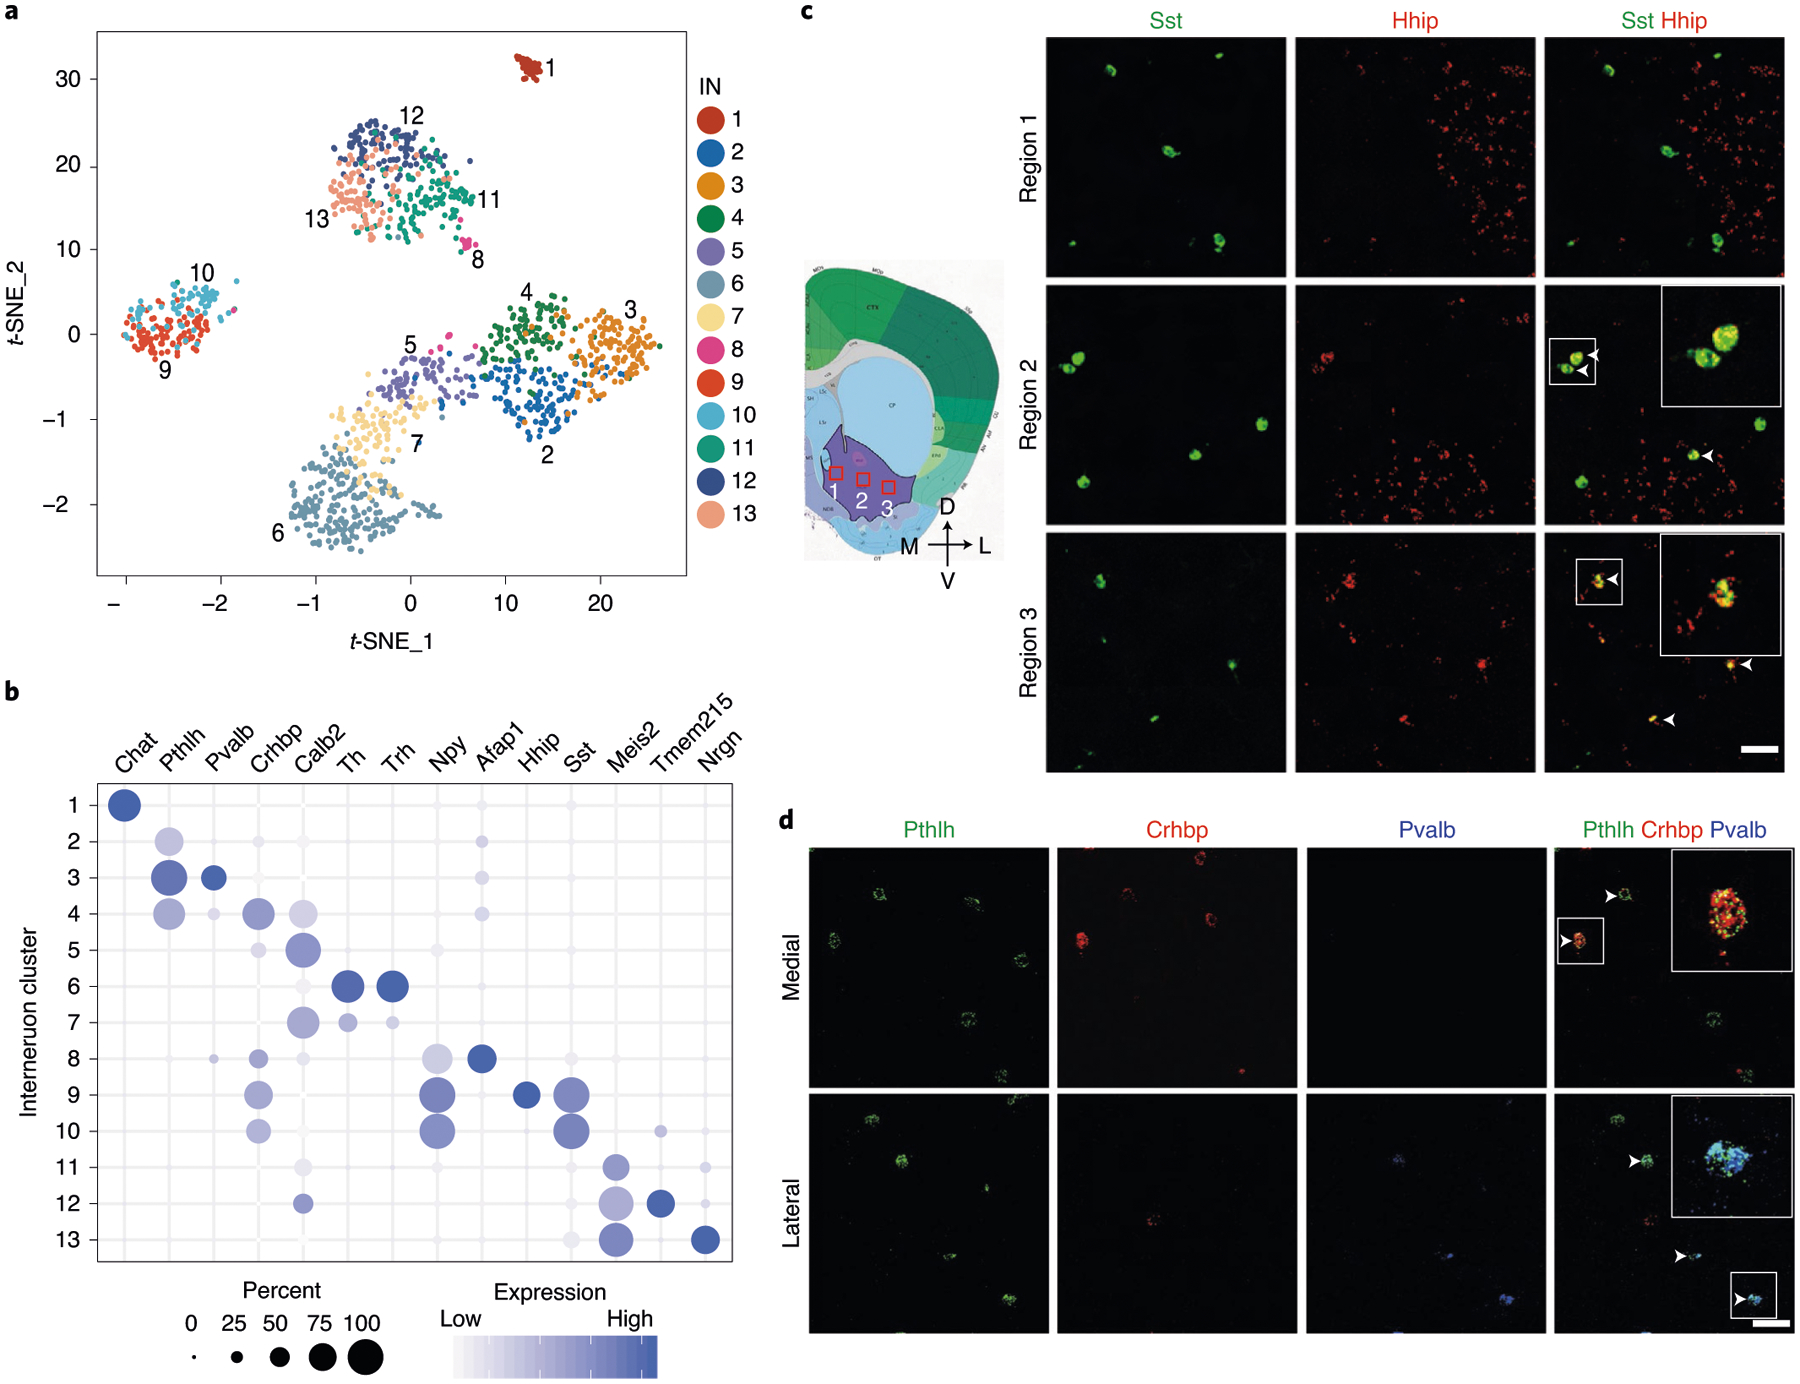
Fig. 2 |. Gene expression and spatial pattern of NAc IN subtypes.

a, t-SNE plot showing the 13 IN subtypes identified in the NAc. DEGs among all subtypes are used for dimension reduction. Different neuron subtypes are color-coded. b, Dot plot showing the expression of selective markers in different NAc IN subtypes. The diameters of the dots represent the percentage of cells within a cluster expressing that gene. The gene expression level is color-coded. c, FISH showing the distribution of Sst+/Hhip+ and Sst+/Hhip− IN subtypes in different subregions of the NAc. The box regions labeled with 1–3 in the left panel indicate different subregions of the NAc (from medial to lateral), which are analyzed in the right panels (from upper to lower). The right panels show the FISH of NAc slice with Sst and Hhip probes. Arrowheads indicate cells co-expressing Sst and Hhip. Three independent experiments were performed with similar results. Scale bar, 100 μm. d, FISH showing the enrichment of distinct Pthlh+ IN subpopulations in different subregions of the NAc. The upper and lower panels represent the medial and lateral regions of the NAc. Triple-color FISH was performed with probes targeting Pthlh, Crhbp and Pvalb. Arrowheads indicate cells co-expressing Pthlh and Crbhp (upper panels) or cells co-expressing Pthlh and Pvalb (lower panels). Three independent experiments were performed with similar results. Scale bar, 50 μm. t-SNE, t-distributed stochastic neighbor embedding.
