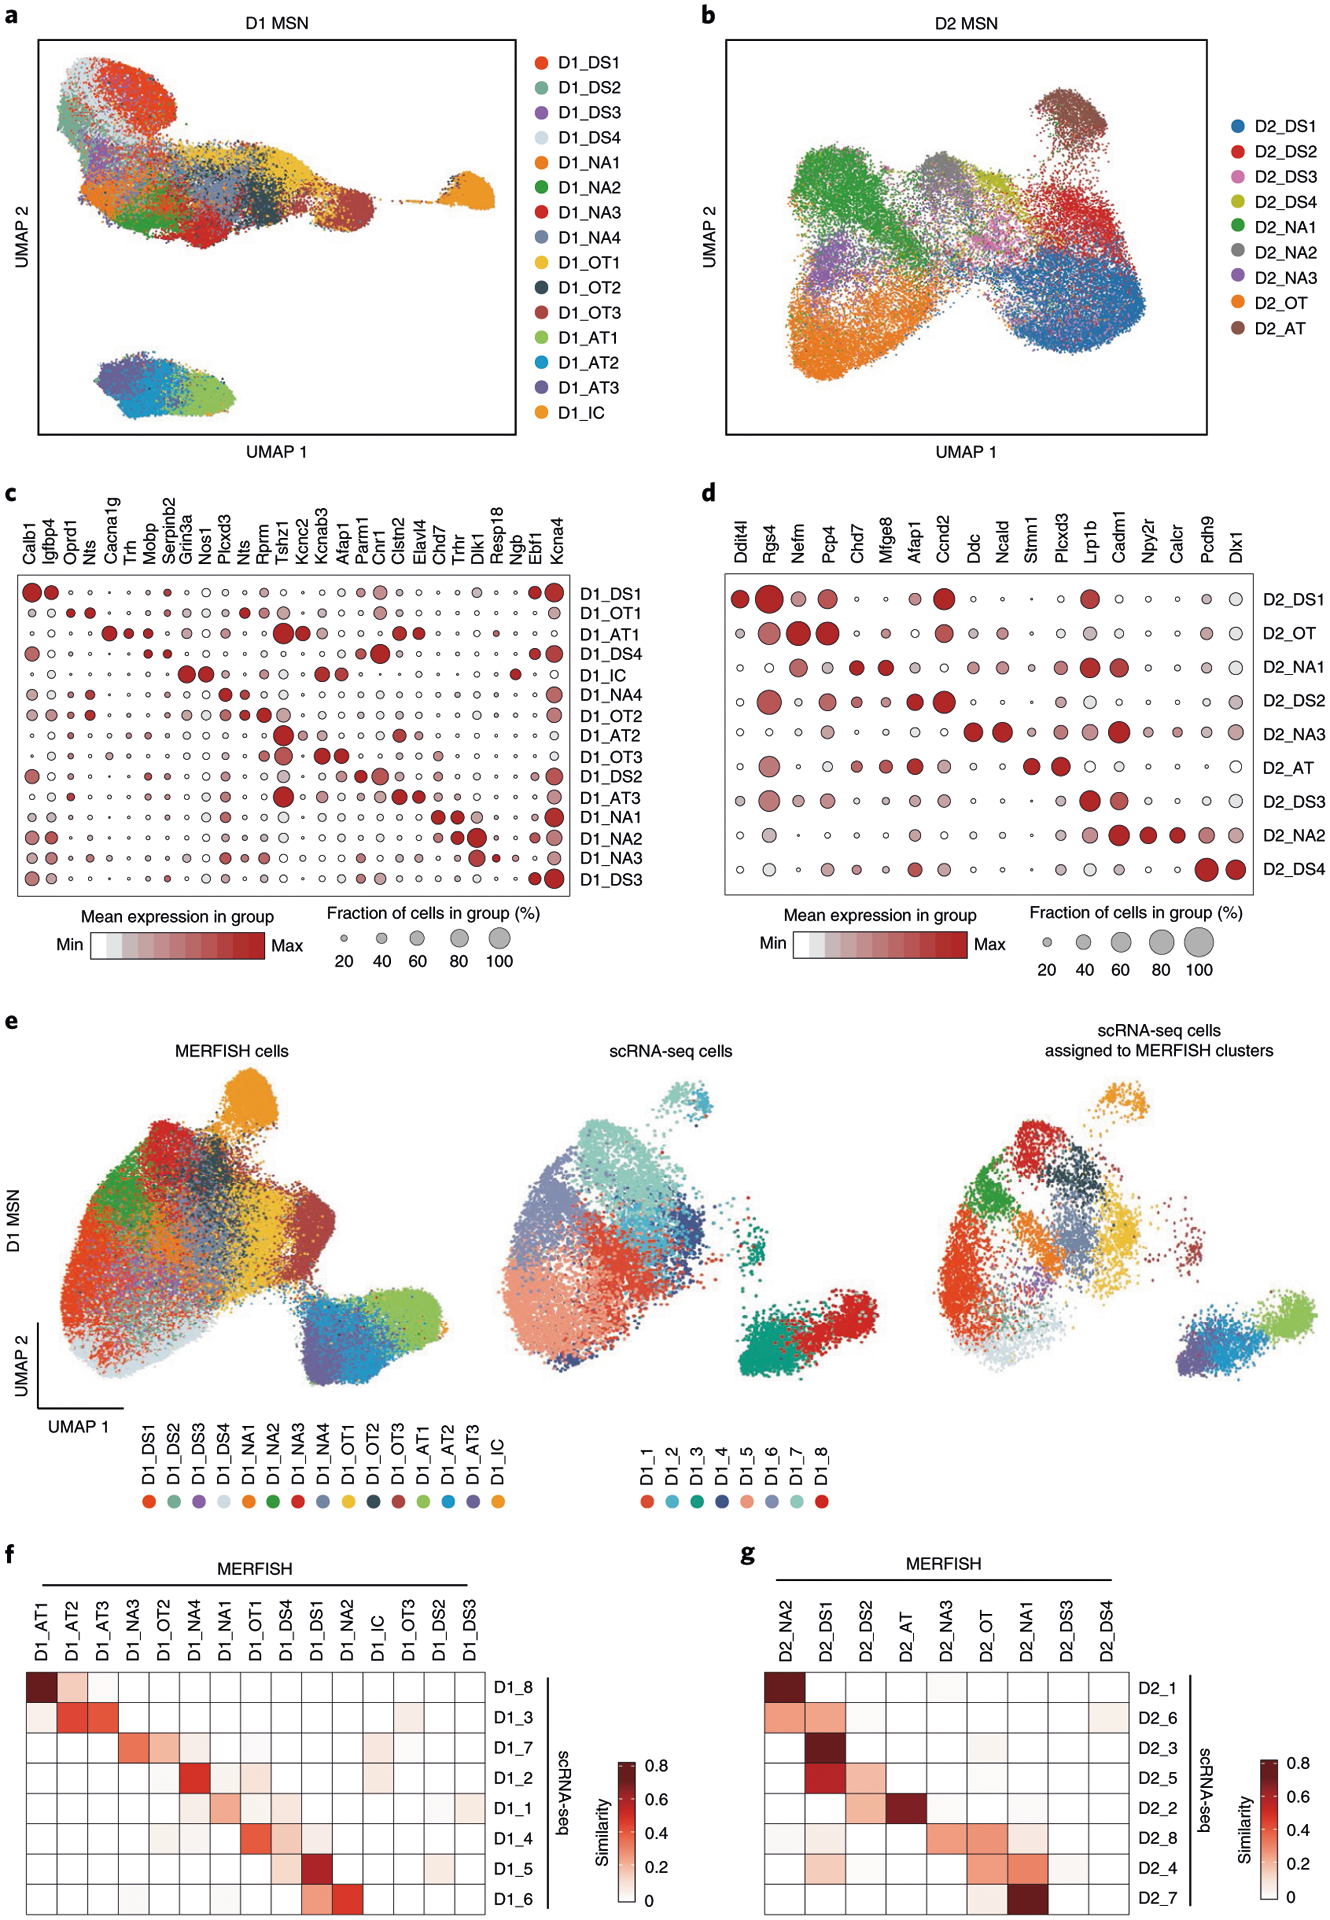
Fig. 5 |. Identification of striatal D1 and D2 MSN subtypes by MERFISH.

a, b, UMAP plot showing the 15 D1 MSN (a) and nine D2 MSN (b) subtypes based on MERFISH data. Different MSN subtypes are presented in different colors in the UMAP plot. The subtypes were named based on their spatial distribution: DS, dorsal striatum; NAc, nucleus accumbens; OT, olfactory tubercle; AT, atypical; IC, island of Calleja. c, d, Dot plot showing the expression pattern of selected genes across the 15 D1 (c) and nine D2 (d) MSN subtypes. The expression level is color-coded. Dot size represents the fraction of cells expressing the gene in each D1 or D2 subtype. e, Integrative analysis of D1 MSNs from MERFISH and scRNA-seq experiments. The D1 MSNs from MERFISH (left) and scRNA-seq (middle) experiments were integrated into the same UMAP space. The identity of each cell is color-coded. Based on the nearest neighbors from the MERFISH experiments, the cells from scRNA-seq were assigned to one of the MERFISH D1 MSN subtypes and are shown in the right panel. f, g, Heat map showing the correspondence between D1 (f) and D2 (g) MSN subtypes revealed by MERFISH and scRNA-seq. The degree of similarity between scRNA-seq and MERFISH cell clusters is defined as the proportion of scRNA-seq cells that could be matched to each MERFISH cluster for each scRNA-seq cluster. The MERFISH subtypes without corresponding scRNA-seq subtypes were largely distributed outside of the NAc.
