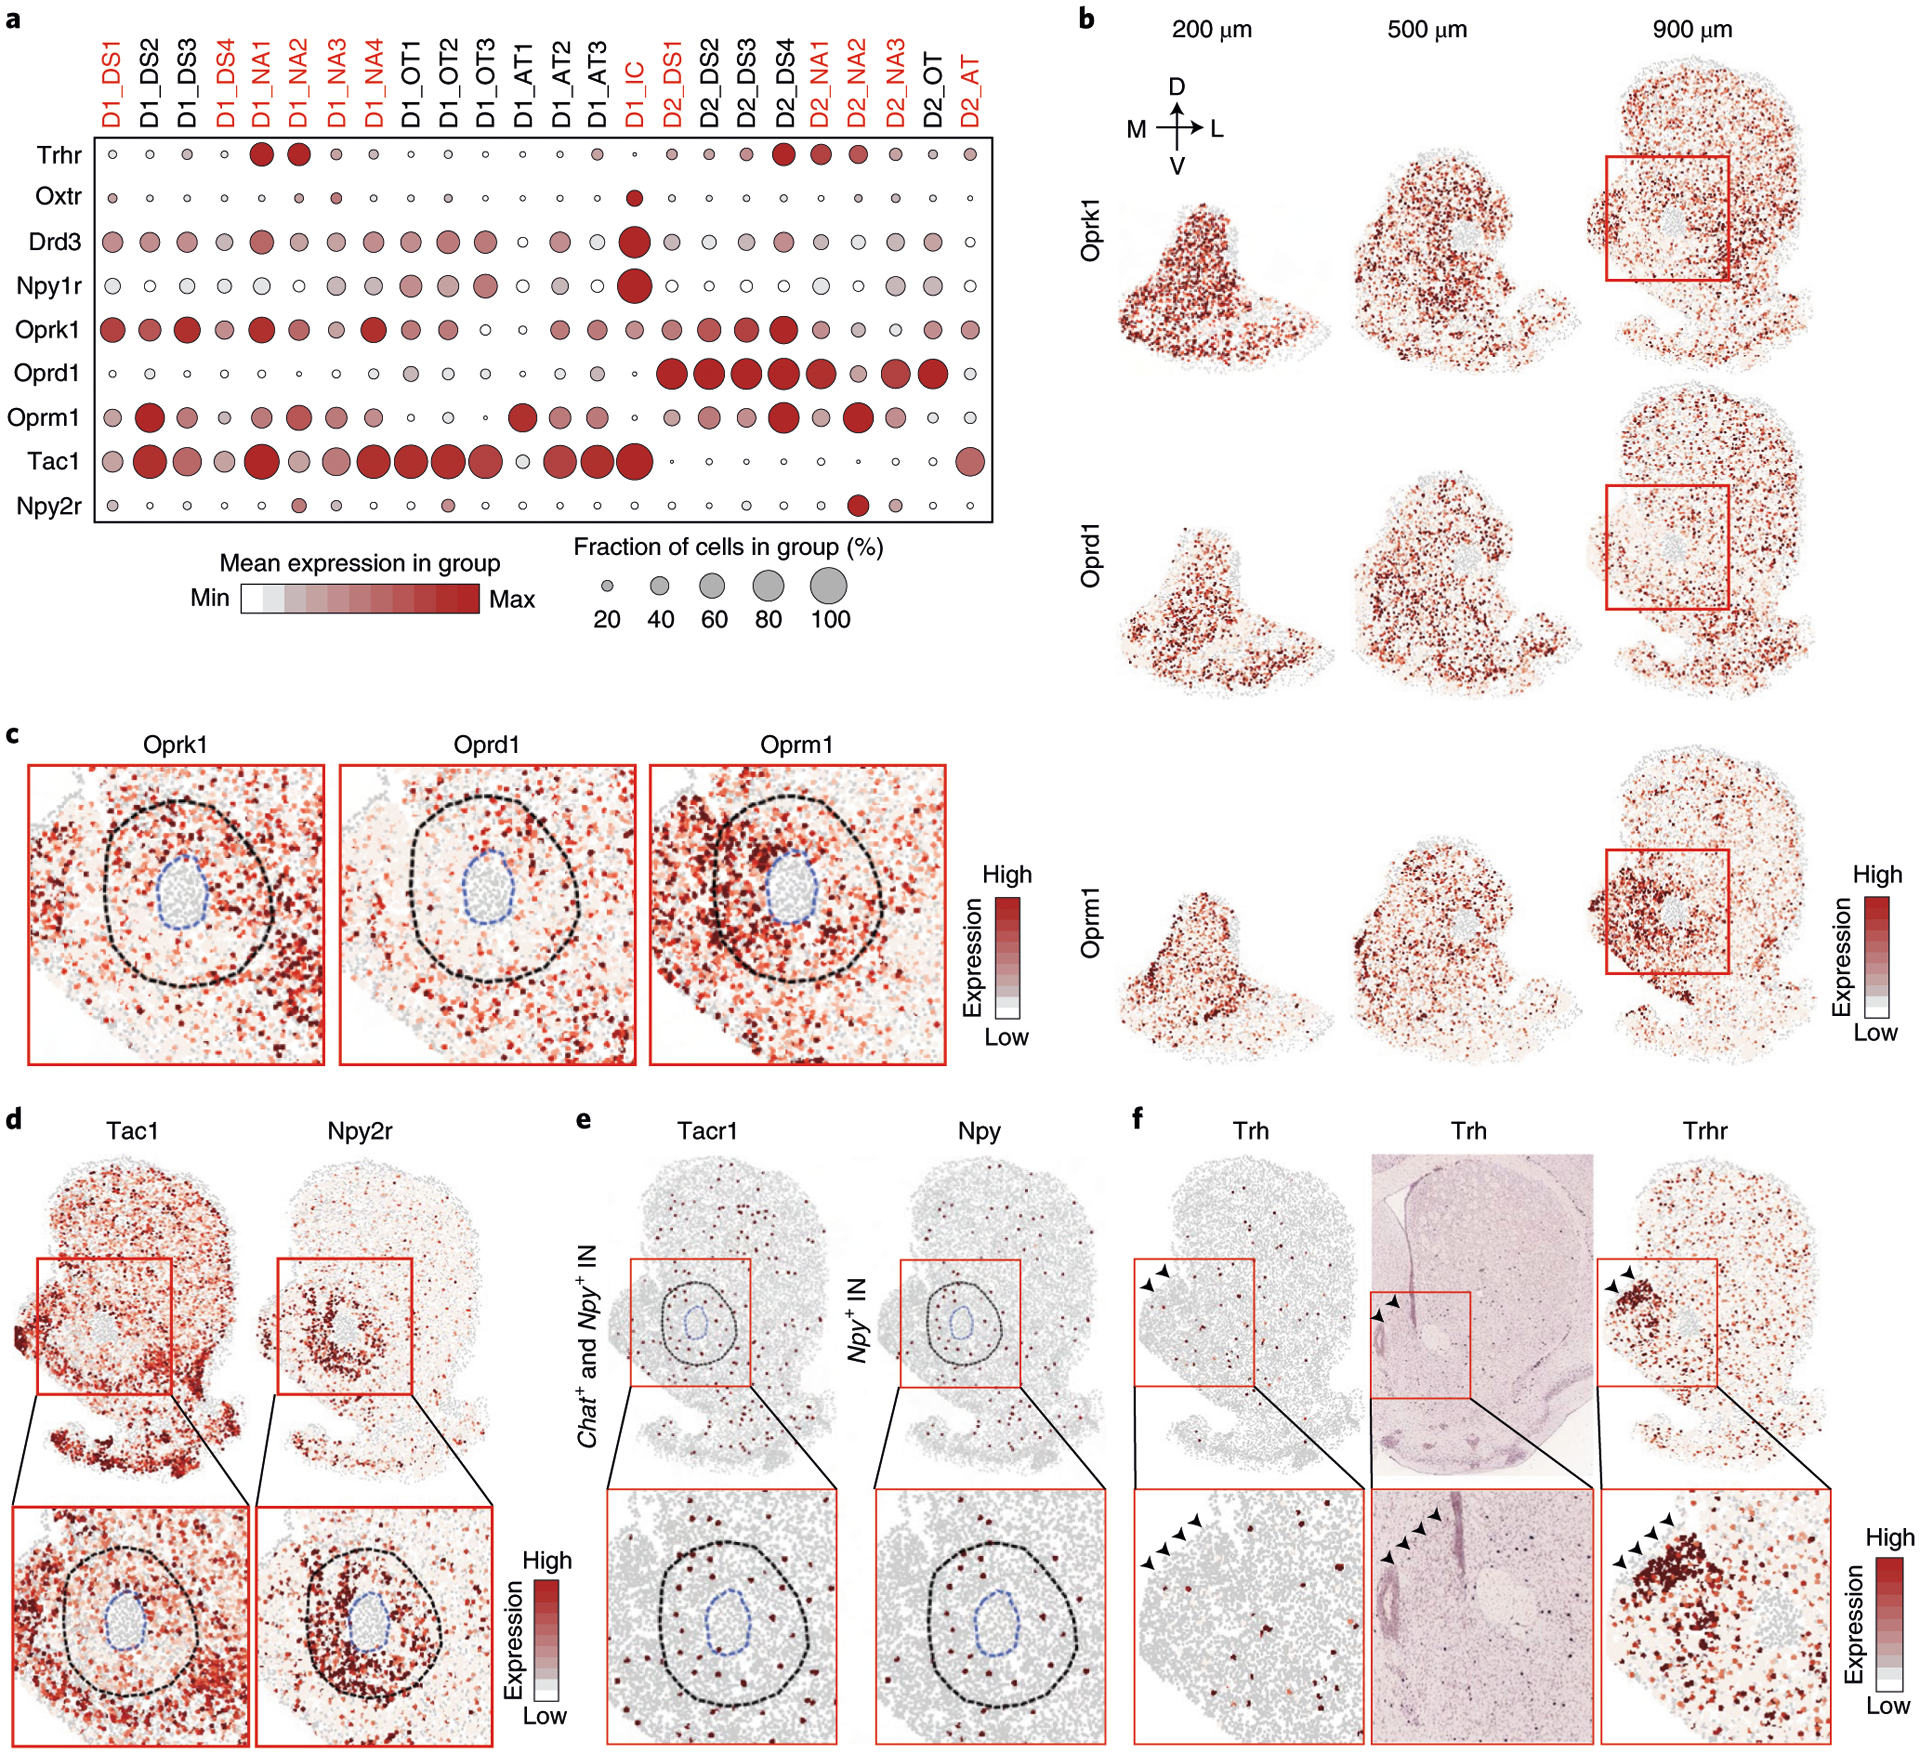
Fig. 8 |. The molecular and spatial features of neuron subtypes underlie functional complexity of the NAc.

a, Dot plot showing the expression patterns of selected functional relevant genes across all the D1 and D2 MSN subtypes. The expression level is color-coded. Dot size represents the fraction of cells expressing the gene in each subtype. The MSN subtypes mentioned in the text are labeled in red. b, Heat map showing the expression of Oprk1, Oprd1 and Oprm1 in coronal sections at different AP positions. The expression level is color-coded. The 200-, 500- and 900-μm labels indicate the distance from the anterior position (bregma 1.94 mm). The dorsal-ventral (DV) and medial-lateral (ML) axes are indicated. c, Heat map showing the expression patterns of Oprk1, Oprd1 and Oprm1 in the NAc core. The boxed regions in b are enlarged and shown. The NAc core and AC structure are labeled with dashed lines. The gene expression level is color-coded. d, Heat map showing the expression patterns of Tac1 and Npy2r in the striatum. The boxed regions in the upper panels are enlarged and shown in the lower panels. The NAc core and AC structure are labeled with blue and black dashed lines, respectively. The gene expression level is color-coded. e, Heat map showing the expression of Tacr1 in Chat+ and Npy+ INs (left) and Npy in Npy+ INs (right). The boxed regions in the upper panels are enlarged and shown in the lower panels. The NAc core and AC structures are labeled with dashed lines. f, Heat map and ISH showing the expression pattern of Trh and Trhr in the striatum. Arrowheads indicate the dorso-medial NAc with enriched Trhr expression. The boxed regions in the upper panels are enlarged and shown in the lower panels. ACC, anterior cingulate cortex.
