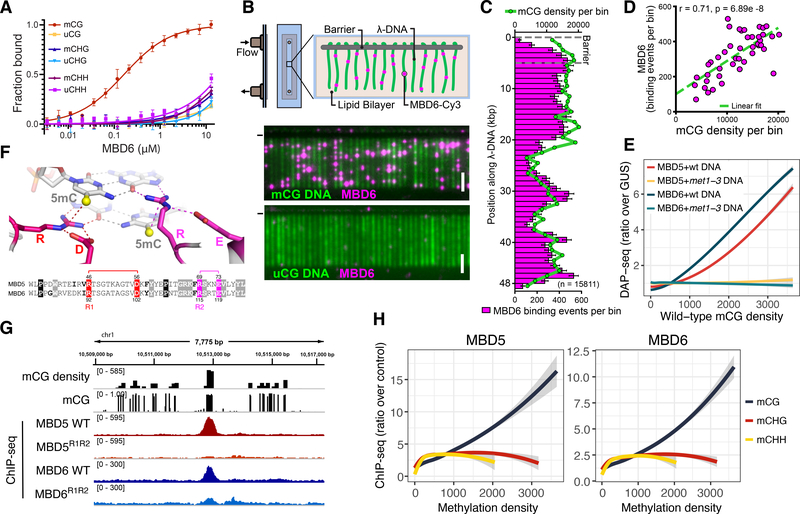
Figure 1: MBD5 and MBD6 are CG specific methyl-readers in vitro and in vivo.
A) Binding curves of MBD6 with DNA oligos methylated (m) or unmethylated (u) in the indicated contexts, measured by fluorescence polarization (N=3, standard error of the mean [SEM]). B) Diagram of DNA curtain assay and representative image of YOYO-1 stained methylated (mCG) and unmethylated (uCG) DNA (green) bound by Cy3-labeled MBD6 (magenta). (−) chrome diffusion barriers. Scale bar - 5 μm. C) Distribution of MBD6 binding events along mCG DNA overlayed with the distribution of mCG density (green line). Error bars: 95% confidence intervals (CI) by bootstrap. D) Correlation scatterplot of MBD6 binding to methylated curtains and mCG density (1 kb bins). R: Pearson. E) Genome-wide correlation between DAP-seq and mCG density (400 bp bins). Trend lines calculated by locally weighted polynomial regression (loess curves). F) Homology models of MBD5 and MBD6. The two arginine residues of the 5mC–Arg–G triads (R1 and R2) are shown in the sequence alignment. G) Example ChIP-seq peaks at regions of dense CG methylation. H) Loess curves of ChIP-seq enrichment and methylation density (400 bp bins overlapping Pol V ChIP-seq peaks). E,H) Shaded area: 95% CI.

