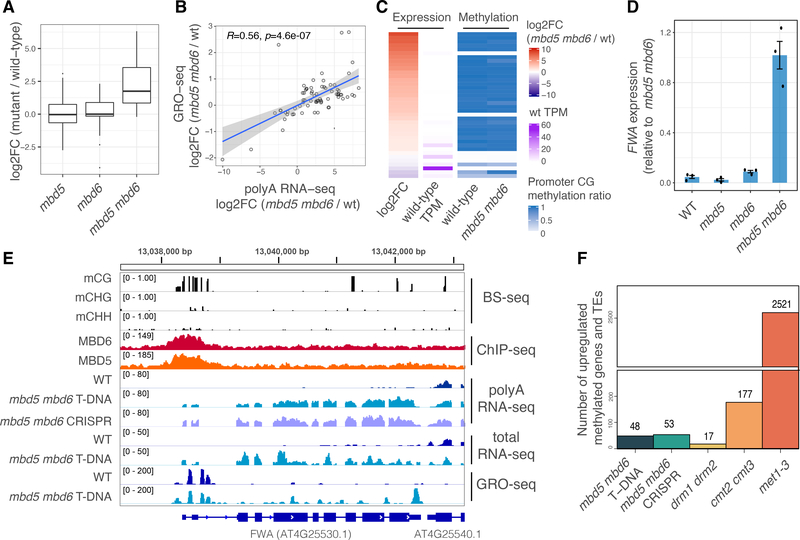
Figure 2: MBD5 and MBD6 redundantly repress a subset of genes and transposons downstream of DNA methylation.
A) Boxplot of polyA RNA-seq for different mutants. Shown are the transcripts (genes and transposons) upregulated in mbd5 mbd6. B) Scatterplot comparing polyA RNA-seq with GRO-seq data at mbd5 mbd6 T-DNA differential transcripts. R and p-value: Spearman. Shaded area: 95% CI. C) Heatmap of mbd5 mbd6 T-DNA differential transcripts, showing polyA RNA-seq and BS-seq data (average methylation ratio at 400 bp windows around the TSS). D) RT-qPCR analysis of FWA expression normalized to IPP2. Dots: individual plants. Error bars: SEM. E) Genome browser tracks at FWA. The GRO-seq enrichment at the FWA promoter likely corresponds to Pol V transcription. F) Number of promoter methylated genes and TEs, upregulated in different mutants.

