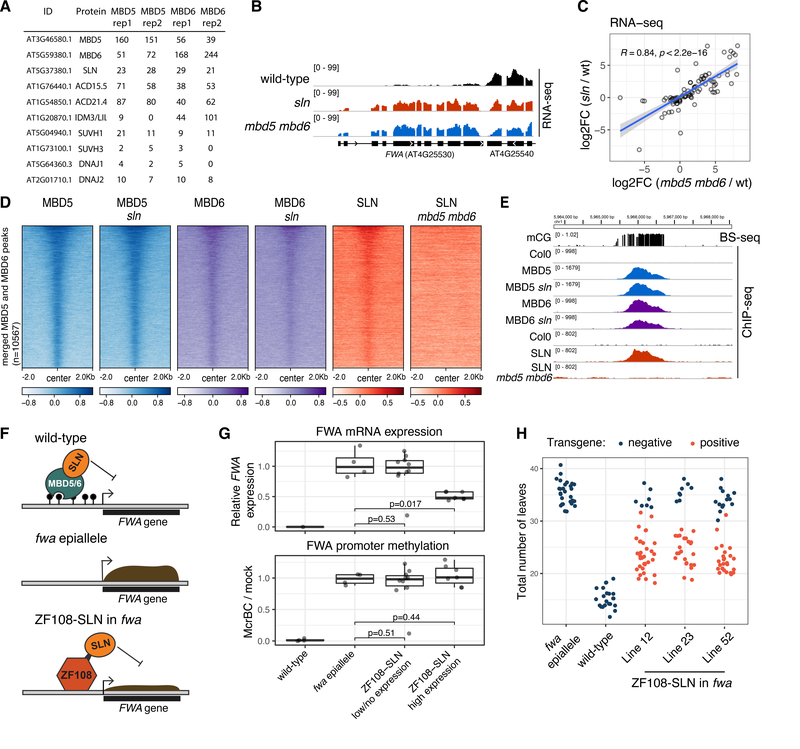
Figure 3: SLN represses transcription downstream of MBD5 and MBD6.
A) IP-MS spectral counts of FLAG-tagged MBD5 and MBD6. All proteins displayed were not detected in the no-FLAG negative control (see Table S1). B) RNA-seq data at FWA. C) Scatterplot of the union of mbd5 mbd6 CRISPR and sln differential transcripts. R and p-value: Spearman. Blue line: linear model fit. Shaded area: 95% CI. D) Heatmap of ChIP-seq data (log2 fold change over no-FLAG control). E) Example methylated site bound by MBD5, MBD6, and SLN, in the indicated backgrounds. F) Cartoon showing SLN’s ectopic recruitment to unmethylated FWA via fusion to ZF108. G) RT-qPCR analysis of FWA expression and McrBC-qPCR analysis of FWA promoter methylation in T1 lines expressing low or high levels of ZF108-SLN (western blot in Figure S15A). Dots: individual plants. P-value: t-test. RT-qPCR data (normalized to IPP2) is relative to fwa epiallele plants. H) Flowering time (number of leaves produced before flowering) of segregating T2 populations from three transgenic lines expressing high levels of ZF108-SLN, comparing transgene positive to null segregant (negative) plants.

