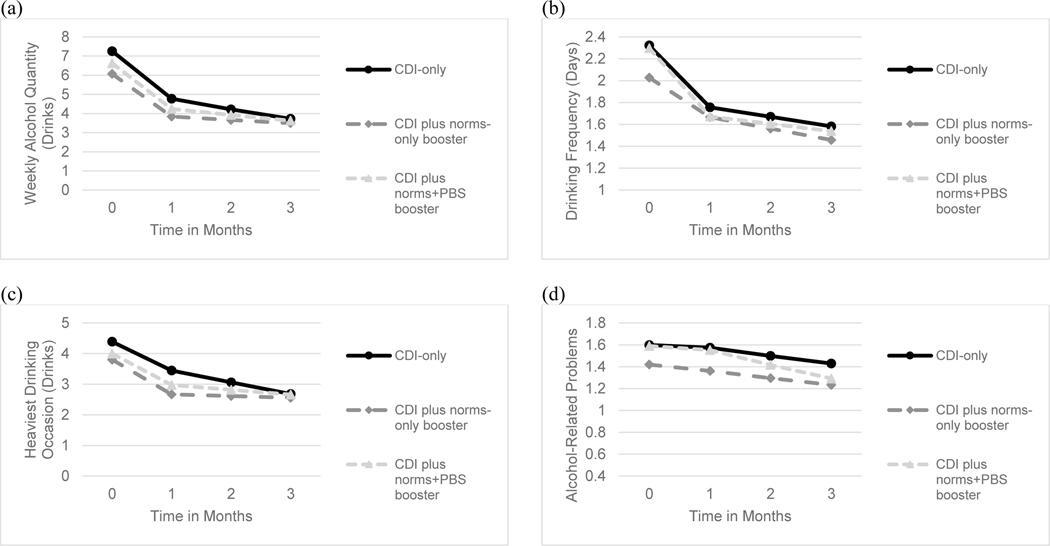
Figure 2. Changes in Alcohol Outcomes over Time by Condition.
Note. CDI = computer-delivered intervention, PBS = protective behavioral strategies. Panel (a) represents quantity (or weekly total drinks), panel (b) represents frequency (or number of drinking days per typical week), panel (c) represents peak drinks (or highest number of drinks on a single day per typical week), and panel (d) represents alcohol-related problems (controlling for quantity).

