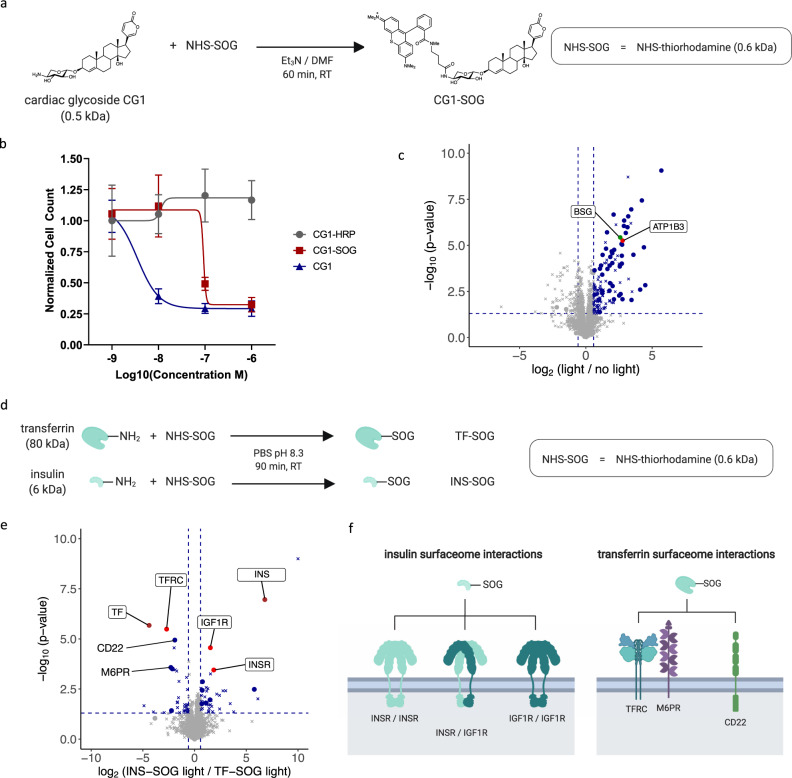
Fig. 3. Decoding surfaceome signaling domains of small-molecule drugs and biomolecules.
a Schematic of coupling the small-molecule drug cardiac glycoside CG1 to the singlet oxygen generator (SOG) thiorhodamine. b Single-cell chemosensitivity screen showing the viability of human promyelocytic leukemia (HL60) cells after incubation with free CG1, CG1 coupled to thiorhodamine (CG1-SOG) or horseradish peroxidase (CG1-HRP) for 48 h. Data are presented as mean values ±SD (n = 10 technical replicates). c Volcano plot showing relative abundance changes of LUX-MS quantified proteins from CG1-SOG treated promyelocytic leukemia HL60 cells with and without illumination for 5 min, tested using a two-sided Student’s t test. Dots and crosses represent cell surface and otherwise annotated proteins, respectively. Red, green and blue dots represent the binding target of CG1, known and previously unknown surfaceome interactors, respectively. The former two are highlighted. d Schematic of coupling the biomolecules insulin and transferrin to the singlet oxygen generator (SOG) thiorhodamine. e Volcano plot showing relative abundance changes of LUX-MS quantified proteins from insulin-SOG and transferrin-SOG treated B-lymphoma SUDHL6 cells illuminated for 5 min, tested using a two-sided Student’s t test. Dots and crosses represent cell surface and otherwise annotated proteins, respectively. Brown, red and blue dots represent the ligand, primary binding target, and potential surfaceome interactors, respectively. The former two are highlighted together with known surfaceome interactors. f Schematic representation of the surfaceome proximity network identified by LUX-MS. Source data are provided as a Source Data file and interactive volcano plots (Supplementary Data 2 and 3).

