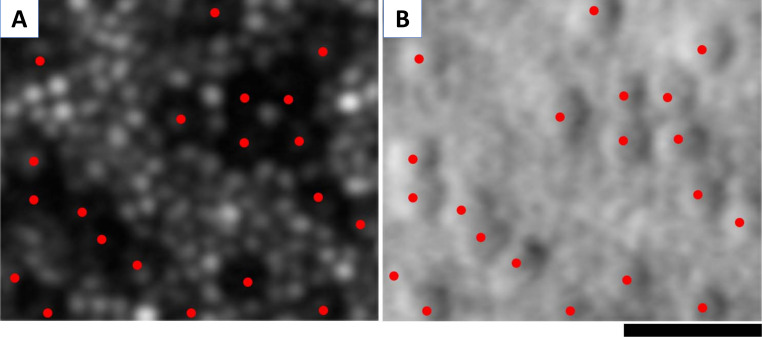
Figure 3.
Cellular imaging with adaptive optics scanning light ophthalmoscopy (AOSLO). AOSLO imaging in CNGA3-associated achromatopsia: (A) confocal image, with red dots marking the ‘dark’ (non-waveguiding) cones. Cones are surrounded by waveguiding rods. (B) Non-confocal (split detection) image over the exact same region with overlying red dots showing the cones marked in (A), which colocalise with cone inner segments, surrounded by rods. Scale bar: 20 µm.

