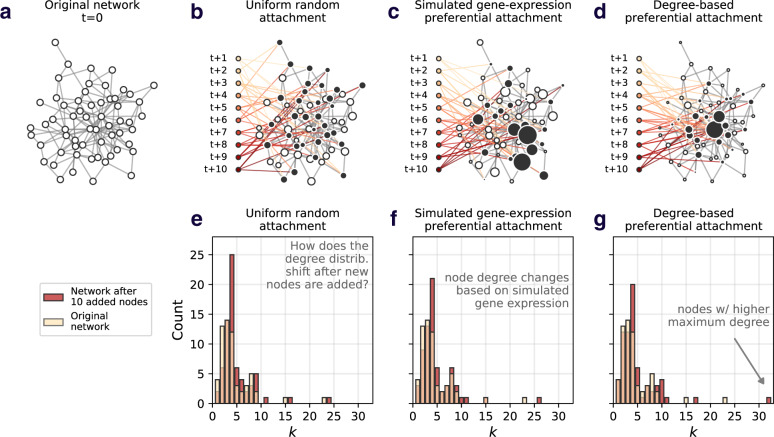
Fig. 3. The effect of attachment mechanism on network structure.
A visual depiction of the effect of adding nodes under different attachment mechanisms. In each example, 10 nodes are added, connecting their m = 4 links to nodes in the original network (indicated by the black nodes). Node size corresponds to its likelihood of gaining new links. a Example network, before node addition. b Example of uniform attachment. c Example of (simulated) gene expression preferential attachment. d Example of degree-based preferential attachment. e–g Depicts the change in the original network’s degree distribution after the addition of 10 nodes, under each attachment mechanism (uniform, gene expression, and degree based). The white bars are transparent to show overlap. While these histograms highlight the change in a single network property (degree, k), one can imagine a number of structural changes occurring following the addition of new nodes, depending on the attachment mechanism.

