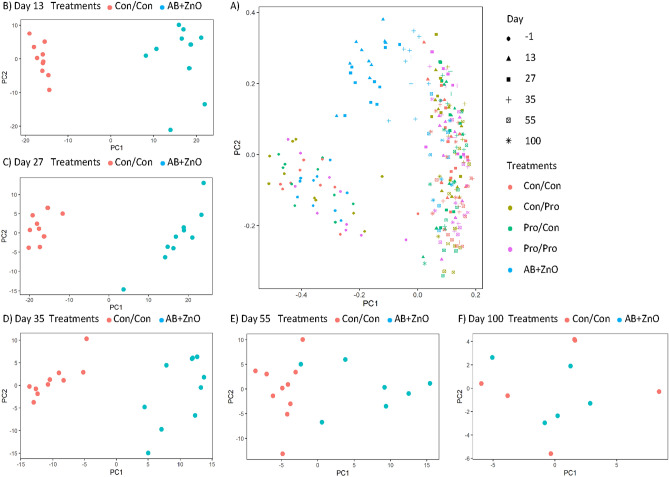
Figure 2.
(A) PCoA plot of the Bray Curtis distances of the faecal microbiota of pigs on all five treatments across all sampling time points. (B–F) PCA plots of the intergroup variation for amplicon sequence variant (ASV) representation at the genus level of the faecal microbiota of Con/Con and AB + ZnO treatments during five time points post-weaning (PW): (B) Day 13 PW, (C) Day 27 PW, (D) Day 35 PW, (E) Day 55 PW, and (F) Day 100 PW. Shapes indicate the day PW that pigs were sampled. Colours indicate the treatments as follows (1st stage weaning period/2nd stage weaning period): Con/Con, Con/Pro, Pro/Con, Pro/Pro, and AB + ZnO; where Con = control, Pro = probiotic and AB + ZnO = antibiotic + ZnO.

