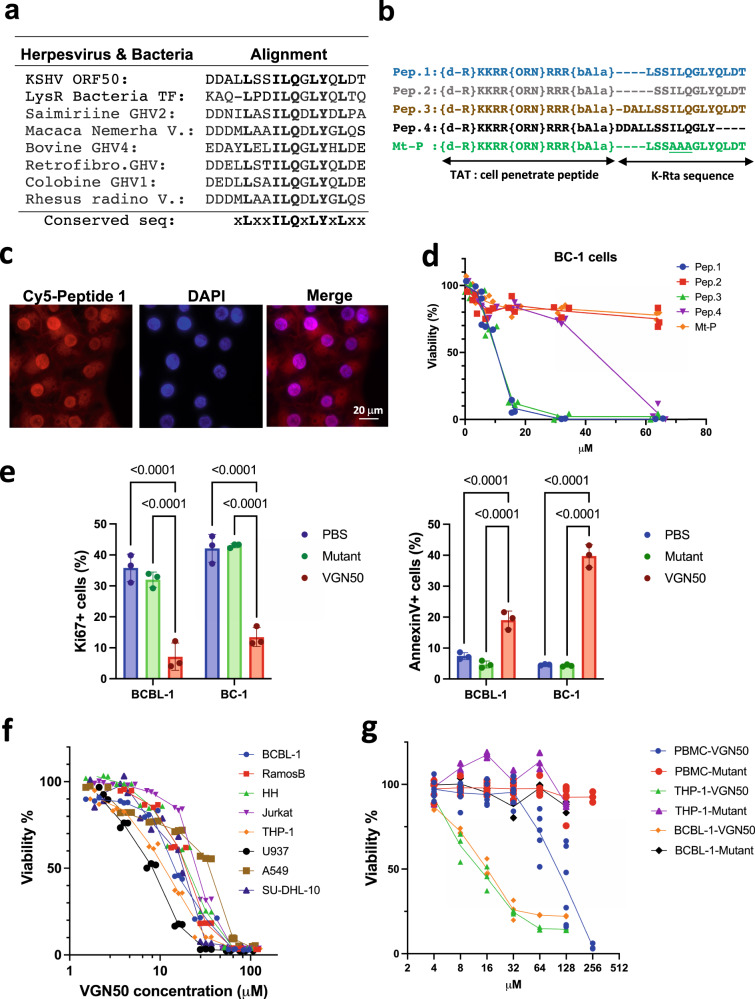
Fig. 2. Viral and cellular responses to K-Rta peptide; identification of VGN50.
a Protein sequence alignment. Homologous protein sequences were searched for with BLAST and extracted from other gamma-herpesviral homologs. The consensus protein sequence is depicted at the bottom of table. b Peptide design. Deletion peptides were designed based on the consensus sequence in a. The TAT protein sequence was used as a cell-penetrating peptide (CPP) and placed downstream from the K-Rta protein sequence. (d-R) d amino acid arginine, (ORN) ornithine, (bAla) beta alanine. c Sub cellular peptide localization. Cy5-labeled peptide 1 was used to track subcellular localization. Nuclei were visualized by DAPI staining. The scale is indicated in the panel. d MTT assays with deletion and mutant peptides. Peptide listed in b were incubated with BC-1 cells and MTT conversion was measured 48 h after incubation. The OD of mock-treated samples were set as 100%, and OD from detergent-treated cells were set as 0%. The amount of each peptide used for incubation is depicted along the x-axis. Mean percentage viability ±SD were calculated for each treatment group (n = 3 samples). Peptide 1 was renamed as VGN50. e Flow cytometry analyses of cell proliferation and apoptosis induction. Cells were incubated with VGN50 or mutant peptide (three alanine substitutions) for 24 h followed by measurements of percentage cell proliferation (Ki67 staining) and apoptosis induction (Annexin V staining). Standard deviation bars are included. (n = 3) Two-way Anova, followed by Sidak’s multiple comparisons test. f The effect of VGN50 on various cancer cell types. MTT assays were performed with the indicated cell lines treated with various VGN50 concentrations. The OD of mock-treated samples were set as 100%, and OD from detergent-treated cells were set as 0%. Mean percentage viability ±SD was calculated for each treatment (n = 3 samples/treatment). g Viability assay with flow cytometry. Cell viability was measured in triplicate with live/dead staining and the cell killing effects on cancer cells was compared with normal peripheral blood mononuclear cells (PBMC) from three healthy donors. Results are presented as mean percentage viability ±SD (n = 3 samples/group). f, g Ordinary one-way Anova, followed by Tukey’s multiple comparisons test.

