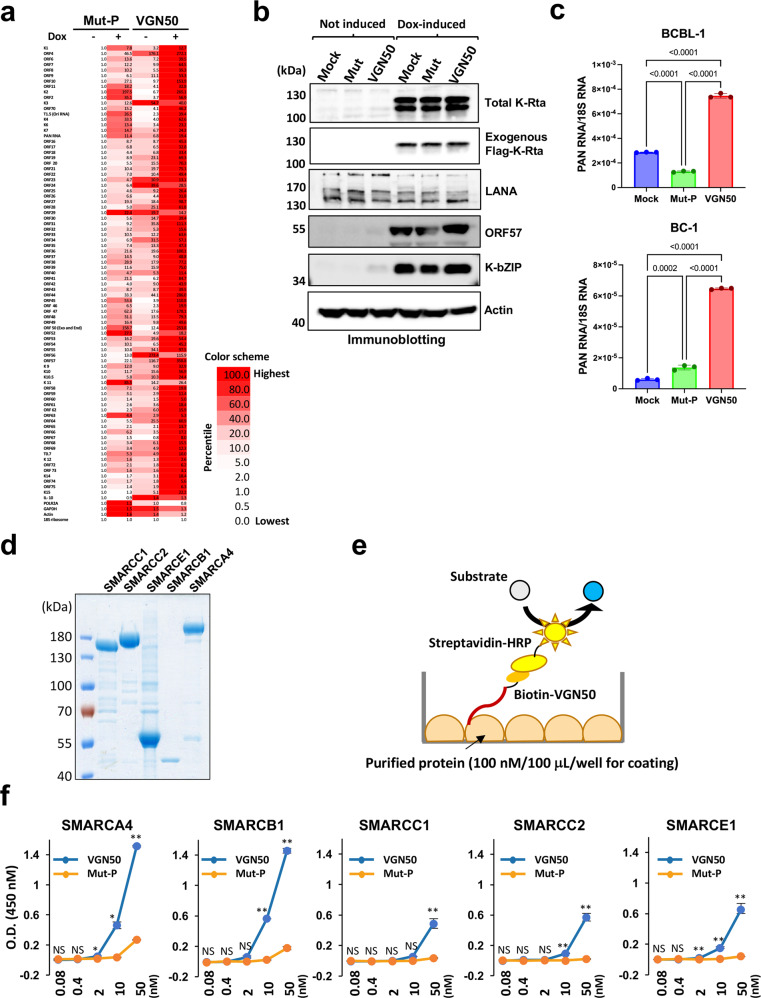
Fig. 3. Effects of VGN50 on KSHV gene transcription and VGN50 binding with SWI/SNF components.
a KSHV qRT-PCR array analysis was used to study effects of VGN50 on KSHV gene transcription in a genome-wide manner. Uninduced (−; no doxycycline added) or dox-induced (+; 1 μg/ml) cells were treated with VGN50 or the mutant peptide (Mut-P) at a concentration of 24 μM. Samples were collected at 24 h post-treatment. Expression in uninduced cells was set as 1 for each viral gene and expression shown as fold activation relative to no-Dox samples. Selected cellular genes were also included in the PCR array for comparison. 18S ribosomal RNA was used as an internal control. b KSHV protein expression. Immunoblotting was performed to confirm both endogenous and exogenous K-Rta expression before (not induced) and after induction by Dox treatment (Dox-induced). Latent KSHV protein LANA and actin were used as controls for KSHV copy number (LANA) and loading (actin), respectively. Protein samples were collected 48-h post Dox incubation. c KSHV reactivation by VGN50 incubation. BCBL-1 and BC-1 cell lines were treated with VGN50 (16 μM concentration) and total RNA harvested at 24 h post treatment. KSHV PAN RNA expression was examined by qRT-PCR and relative expression over 18S rRNA is shown. Data are presented as mean ± SD (n = 3). d Purification of recombinant SWI/SNF components. SDS-PAGE analysis of five SWI/SNF components individually prepared from baculovirus-infected Sf9 cells. e A schematic illustration of ELISA assay to evaluate VGN50 and SWI/SNF interaction. f Analysis of VGN50 binding to SWI/SNF components by ELISA. Increasing concentrations of biotin-conjugated VGN50 or Mut-P were incubated in duplicate in an ELISA plate coated with each SWI/SNF component. Peptide binding measured as OD values at 450 nm are shown. Mean OD values were compared between the VGN50 and Mut-P in each concentration using unpaired t-test. **p < 0.01, *p < 0.05, NS no significance. Data are presented as mean ± SD with duplicated samples and repeated three times with different purified protein preps.

