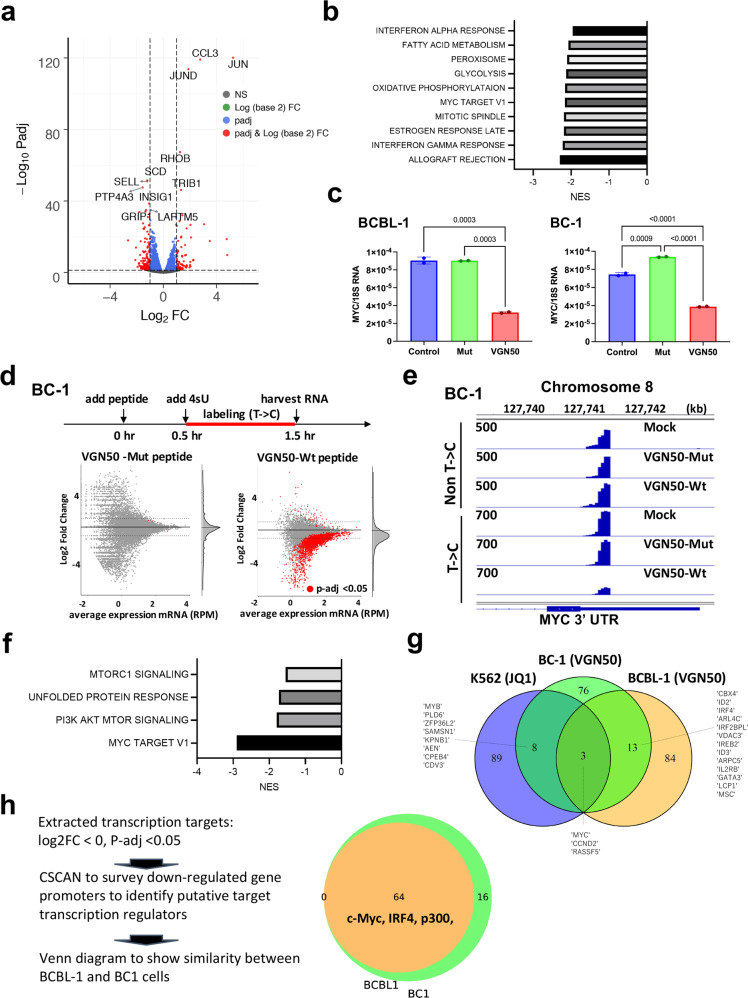
Fig. 4. VGN50 target identification with RNA-sequencing.
a Total RNA-sequencing. BCBL-1 cells were treated with either VGN50 or mutant peptide for 24 h (24 μM, n = 3). Untreated cells were used as a negative control. RNA-sequencing datasets from VGN50-peptide-treated samples were compared with that from mutant-peptide-treated samples, and differentially regulated genes were depicted as a volcano plot (left panel). b Gene Set Enrichment Analyses (GSEA). GSEA was performed on differentially regulated genes and enriched, down-regulated cellular pathways are shown in the Table. c MYC down-regulation by VGN50. Peptide-treated samples were used for qRT-PCR analysis in duplicate and confirmed MYC down-regulation. (VGN50, 24 μM, 24 h post treatment) d Direct target identification with SLAM-seq. The experimental scheme is shown in the upper section of the panel. VGN50 or mutant peptide (24 μM final concentration) were added to BC-1 or BCBL-1 cells 30 mins prior to incubation with 4sU, and RNA was labeled for 1 h in the presence of each peptide. The C/T converted RNA-species were compared with mock-treated samples and depicted as scatter plots. Each treatment was performed in duplicate and nascent transcripts with p-values <0.05 are indicated as red dots. e Integrative Genomics Viewer (IGV). Both non-T/C converted and converted sequence reads were visualized with the IGV, and a snapshot of the MYC 3′-UTR region is presented. SLAM-seq libraries were made with dT-primers demonstrating sharp peaks at the 3′-UTR. f GSEA analyses for VGN50 direct targets. GSEA was performed with the group of genes that were down-regulated by VGN50 (LogFC < 0, p < 0.05). g Comparisons of JQ1 and VGN50 direct target genes. The top 100 down-regulated target genes for each treatment were extracted and used to generate a Venn diagram in order to examine similarity. Commonly down-regulated gene names are depicted. h Co-occupancies of regulatory proteins in down-modulated genes. The strategy of gene selection for CSAN is described on the left-hand side of the panel. CSCAN was applied to extract potential binding proteins on down-regulated gene promoters (−450 to +50 bp). The number of common transcriptional regulators are shown in the Venn diagram and selected transcription and co-regulatory protein names are also included. The complete list of gene names is presented in Supplementary Fig. 3.

