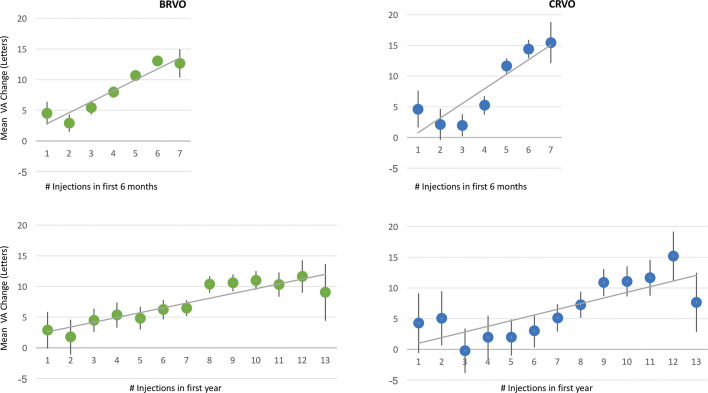
Figure 2.
Graphs showing change in visual acuity (VA) versus antivascular endothelial growth factor injections administered to all patient eyes with retinal vein occlusion in 6 months and 1 year. The 95% CIs are included. Mean VA change tended to increase with greater treatment intensity. BRVO, branch retinal vein occlusion; CRVO, central retinal vein occlusion.

