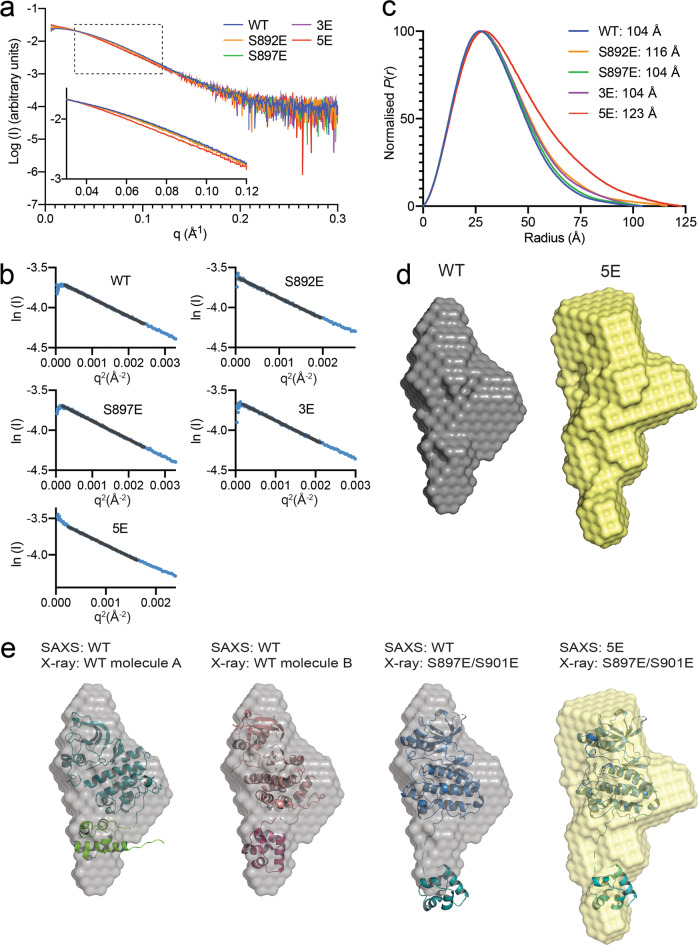
Fig. 3. SEC-SAXS analysis of the EphA2 intracellular region.
a Small angle X-ray scattering profiles of averaged, and background subtracted data from the apex of the inline size exclusion chromatography peak for EphA2 WT (residues S570-I976) and 5 mutants as indicated. b Guinier analysis of the data shown in a; the Guinier fit is indicated by a black line. c Pairwise distance distribution, P(r), plot, calculated from scattering data with GNOM. Maximum particle dimensions (Dmax) are indicated for each mutant. d Ab initio SAXS envelopes for EphA2 WT and EphA2 5E calculated with DAMIFF. e Comparison between SAXS envelopes for EphA2 WT and 5E mutant with the crystal structures of EphA2 WT (molecules A and B) and the S897E/S901E mutant. Source data for a, b, c are provided in the Source Data file.

