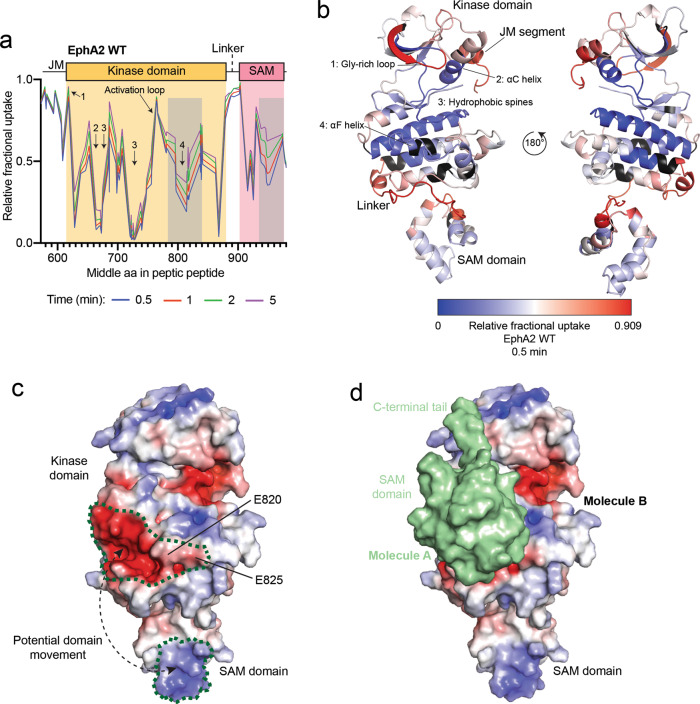
Fig. 4. HDX-MS analysis of the EphA2 WT intracellular region.
a Relative fractional deuterium uptake plot for peptic peptides identified from EphA2 WT after 0.5, 1, 2 and 5 min. Key domains of the EphA2 intracellular region are indicated and parts of the kinase domain are indicated with Arabic numerals (see also panel b). The gray shaded areas indicate regions of intermediate exchange, as described in the text. b Relative fractional deuterium uptake after 0.5 min, mapped onto the EphA2 WT structure (molecule B). Residues without coverage are colored in black. Domains and key regions are indicated. c Electrostatic surface of the EphA2 WT structure in the same orientation as in b, left. The positively-charged (blue) region in the SAM domain and the negatively-charged (red) region in the kinase domain are outlined with a green dotted line. A potential domain movement is indicated by dashed line with arrows. This interaction is possible due to the 20-amino acid flexible linker connecting the SAM and kinase domains. d Intermolecular interaction between the EphA2 kinase and SAM domains as observed in our EphA2 WT crystal structure. EphA2 molecule B is shown as in panel c with the SAM domain of molecule A shown as green surface. Source data for a are provided in the Source Data file.

