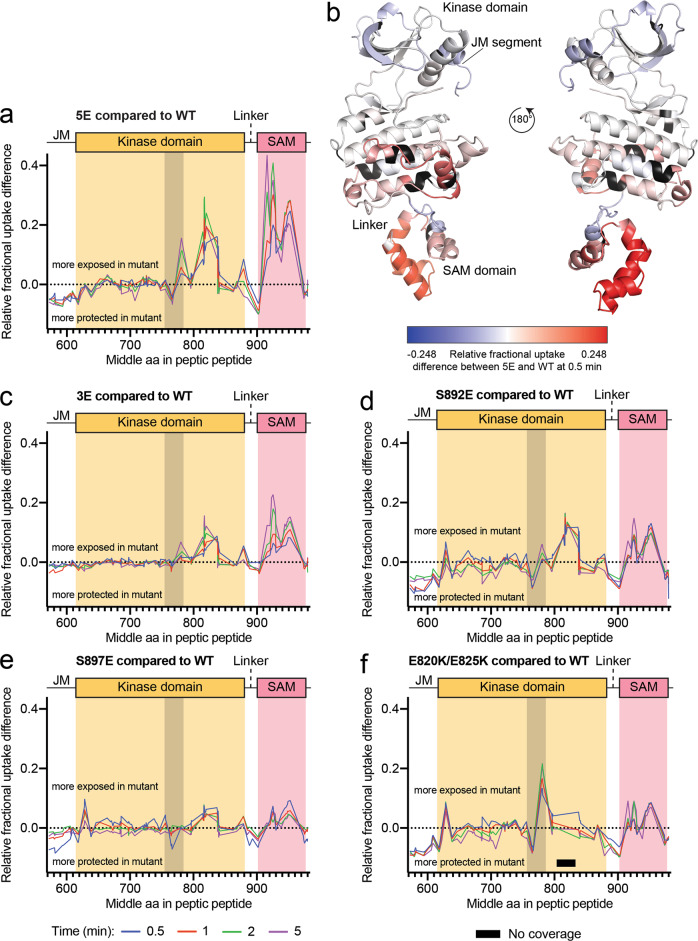
Fig. 5. HDX-MS analysis of the EphA2 intracellular region with kinase-SAM linker phosphomimetic mutations.
a Fractional deuterium uptake difference plot comparing the EphA2 5E mutant with EphA2 WT after 0.5, 1, 2 and 5 min of exchange. Positive values indicate more rapid exchange in the 5E mutant compared to WT, whereas negative values indicate slower exchange in the mutant compared to WT. The gray shaded area indicates the activation loop (D757-E787). b Relative fractional deuterium uptake differences between WT and the 5E mutant after 0.5 min mapped onto the EphA2 WT structure (molecule B). Relative fractional differences from −0.248 (less exposed in the 5E mutant) to 0.248 (more exposed in the 5E mutant) are colored in a gradient from blue to red. Residues without coverage are colored in black. c–f Graphs as in panel a, comparing fractional deuterium uptake differences between the indicated EphA2 mutants and EphA2 WT. The gray shaded area indicates the activation loop (D757-E787) and the black bar in f indicates a region without peptide coverage in the E820K/E825K mutant. Source data for a, c, d, e, f are provided in the Source Data file.

