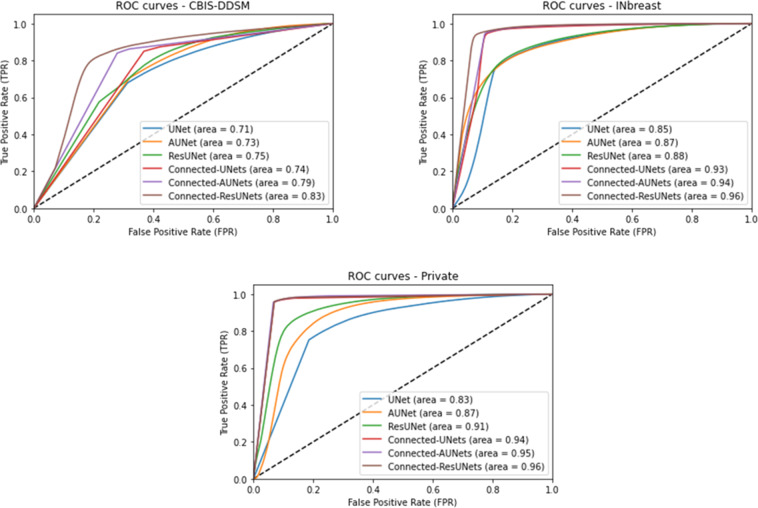
Fig. 1. Performance of mass segmentation using the different architectures in terms of ROC curves on the test sets of CBIS-DDSM, INbreast, and the private datasets.
ROC curve plots with True positive Rate (TPR) against the False Positive Rate (FPR) and area under curve for pixel-wise evaluation of the standard models (UNet, AUNet, and ResUNet) and for the proposed architecture models (Connected-UNets, Connected-AUNets, and Connected-ResUNets). Subplot on the left shows ROC curve plot for the CBIS-DDSM dataset. Subplot on the right shows ROC curve plot for the INbreast dataset. Subplot on the bottom shows ROC curve plot for the private dataset.

