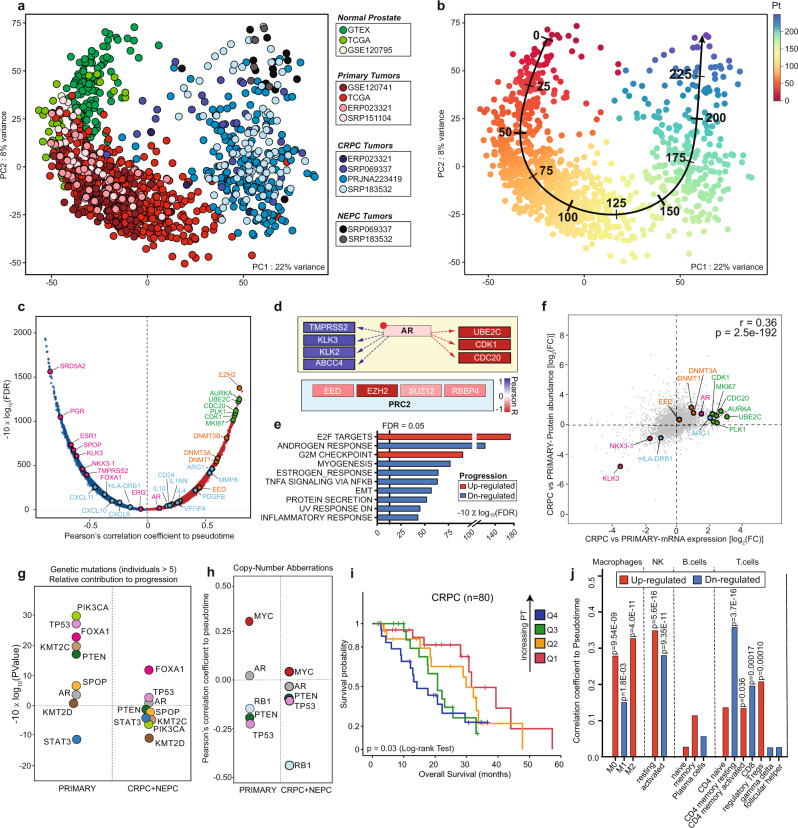
Fig. 1. Trajectory to prostate cancer progression.
a Principal component analysis (PCA) of pan-prostate cancer transcriptomes obtained from the indicated studies of normal (shades of green), primary (shades of red), castration-resistant (CRPC, shades of blue), and neuroendocrine prostate cancer (NEPC, shades of gray). See Source data file. b Unbiased trajectory analysis identifies the path to disease progression. Quantification of the path is indicated by inferred pseudotime. See Source data file. c Plot representing the correlation between mRNAs and pseudotime inferred along the trajectory. Positively correlated genes are depicted in red while negatively correlated genes are depicted in blue. Polycomb-repressive complex-related genes highlighted in orange, cell cycle-related genes in green, immune response in light blue, and AR signaling in magenta. X-axis: Pearson’s correlation coefficient between mRNAs and pseudotime; Y-axis: the associated significance adjusted for false discovery rate (FDR) and expressed in the form of −10 × log 10(FDR). See Source data file. d Schematic representation of gene-expression changes in AR-regulated target genes related to cell differentiation and proliferation and PRC2 components along the trajectory. Genes are enclosed in boxes, whose color is associated to the correlation coefficients between mRNA expression and pseudotime, and are depicted in the indicated color scale. e Gene-set enrichment analysis performed on genes ranked for their Pearson’s coefficient as determined by the correlation between mRNA expression and pseudotime inferred from the trajectory. Increasing pseudotime results in an increase of cell cycle-related genes and concomitant downregulation of androgen-responsive genes. Upregulated: red; downregulated: blue. See Source data file. f Scatterplot revealing Pearson’s correlation coefficient and associated P value between mRNAs and protein abundances, expressed in the form of fold change (log-scale) between CRPCs and primary tumors. Polycomb-repressive complex-related genes highlighted in orange, cell cycle-related genes in green, immune response in light blue, and AR signaling in magenta. See Source data file. g P values associated to Pearson’s correlation coefficients expressed in form of −10 × log 10(P value) (FDR-adjusted). Coefficients were determined for the correlation between somatic mutations (0: wild type; 1: non-synonymous mutation) and inferred pseudotime along the trajectory. To dissect the relative impact on disease progression at different stages, coefficients were computed separately in primary and CRPC/NEPC samples. Only recurrently mutated genes (at least in six individuals) were taken into account. PIK3CA (green); TP53 (pink); PTEN (dark green); SPOP (orange); AR (gray); KMT2D (brown); KMT2C (light brown); STAT3 (blue). See Source data file. h Computed Pearson’s correlation coefficients between samples’ numeric copy-number status (−2: homozygous deletion; −1: heterozygous deletion; 0: wild type; 1: gain; 2: amplification) and inferred pseudotime, stratified for primary and metastatic tumors (CRPC, NEPC). MYC (red); AR (gray); RB1 (light blue); PTEN (dark green); TP53 (pink). i Kaplan–Meier curve for disease-free survival in CRPC patients stratified according to pseudotime using a four-tiered scoring system (quartiles: Q1, Q2, Q3, and Q4) reveals a significant association of higher pseudotime with impaired survival. Source: cBioportal (SU2C/PCF Dream Team, PNAS 2019). P value was determined by using log-rank test. Q1 (red, n = 20); Q2 (orange, n = 20); Q3 (green, n = 20); Q4 (blue, n = 19). For one patient, two metastatic samples were available. We discarded the sample with the lower pseudotime. See Source data file. j Histograms depicting the correlation between the inferred abundance of the indicated immune cell populations (as determined by Cibersortx) and pseudotime. P values associated with Pearson’s correlation coefficients were adjusted for multiple testing using false discovery rate (FDR) and reported on top of the bars. Red: positive correlation; blue: negative correlation. See Source data file.

