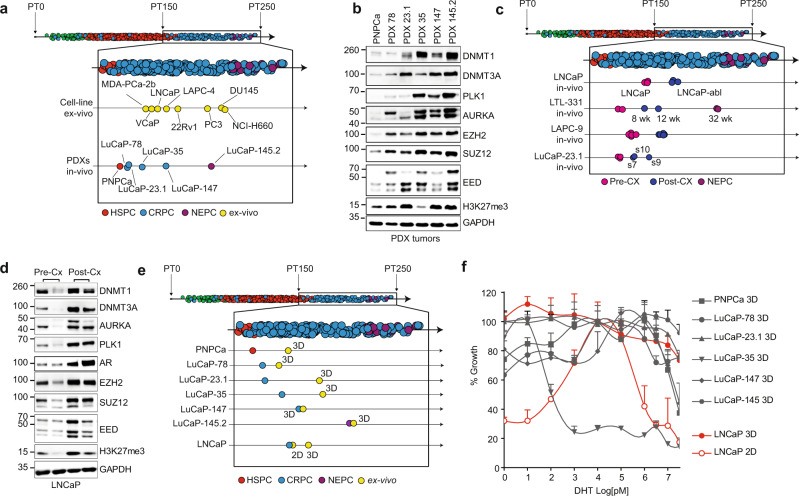
Fig. 2. Mapping of human prostate cancer models to the trajectory.
a Projection of the indicated human cell lines ex vivo and patient-derived xenograft (PDX) models in vivo to the pseudotime (PT) inferred trajectory. Normal prostate: green; hormone-sensitive tumors (HSPC): red; castration-resistant (CRPC) tumors: blue; neuroendocrine (NEPC) tumors: violet; ex vivo cell lines: yellow. Representative replicates for each sample are shown. See Source data file. b Immunoblotting analysis of the indicated proteins across PDX models indicates an upregulation of polycomb-repressive complex-2 members and G2M cell cycle checkpoint genes. Experiments were repeated at least three times with similar results. See Source data file. c Androgen-dependent xenograft models progress along the trajectory when developing castration resistance. Normal prostate: green; hormone-sensitive tumors (HSPC): red; castration-resistant (CRPC) tumors: blue; neuroendocrine (NEPC) tumors: violet; pre-castration (Pre-CX) PDX models: magenta; post castration (Post-CX) PDX models: dark blue; Wk weeks; s7, s9, and s10 indicate different clones derived from LuCaP-23.1 PDX model. See Source data file. d Immunoblot analysis of LNCaP xenograft models shows upregulation of AR, polycomb-repressive complex-2 members, and G2M cell cycle checkpoint genes upon recurrence after castration (Cx). Experiments were repeated at least three times with similar results. See Source data file. e Three-dimensional (3D) ex vivo cultures in Matrigel of the indicated PDX and the xenografted LNCaP cells show higher PT than their in vivo counterparts. Normal prostate: green; hormone-sensitive tumors (HSPC): red; castration-resistant (CRPC) tumors: blue; neuroendocrine (NEPC) tumors: violet; ex vivo: yellow. Representative replicates for each sample are shown. Individual replicates are depicted in Supplementary Fig. 2. See Source data file. f Dihydrotestosterone (DHT) dose–response curves of the indicated models in 3D using Matrigel versus standard 2D culture. In the 3D conditions, DHT dependency is largely abolished. For each curve, n = 3 biologically independent experiments are reported (three animals for each curve). Error bars represent standard errors for each time point. LNCaP: red; PNPCa, LuCaP and PNPCa models: gray. See Source data file.

