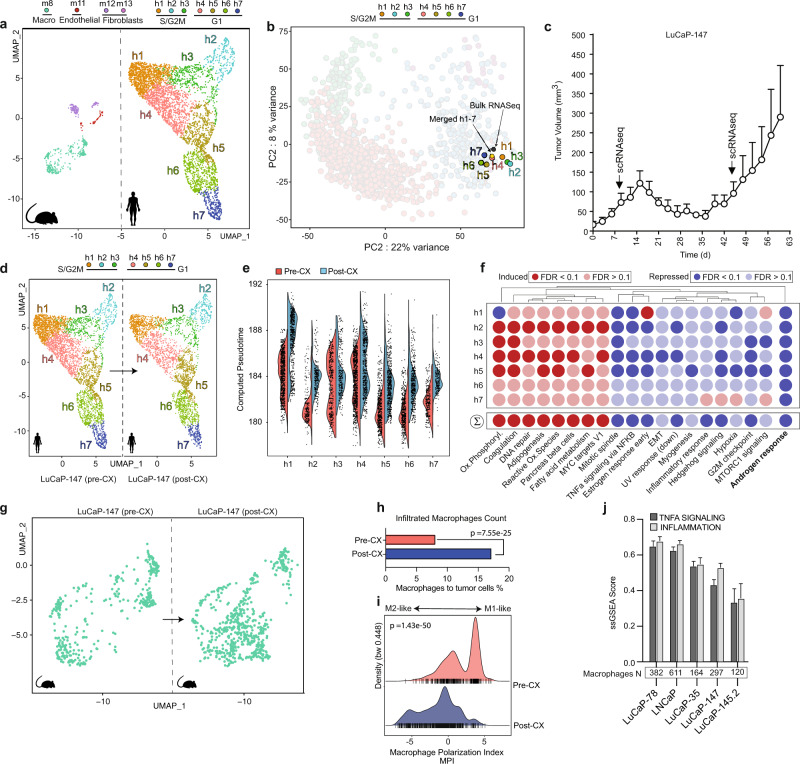
Fig. 3. Single-cell resolution to the trajectory.
a Dimensionality reduction of single-cell distribution of LuCaP-147 PDX model in vivo using Uniform Manifold Approximation and Projection (UMAP) and subsequent identification of cell clusters performed using Seurat46 workflow. Human (right) and mouse cells (left) are separated from each other. A total amount of 7 and 4 clusters could be identified for human and mouse cells, respectively. For the latter, we indicated the cells of origin corresponding to the various clusters on top. Inference of cell types was performed with SingleR86 through the exploitation of the ImmGen repository87. For human cell clusters, we indicated the inferred cell cycle phase as predicted using Seurat. Human and murine cell clusters are depicted using different colors as indicated on top of the figure panel. b Projection of single-cell clusters on the PCA plot. The position of merged single-cell data corresponds to the one from bulk RNA-sequencing data. Please refer to the “Methods” section for detailed information on scRNA-seq data integration with bulk RNA-seq. Cell clusters are depicted using different colors as indicated on top of the figure panel. c LuCaP-147 xenografts regress and regrow within 4 weeks after castration. N = 5 independent experiments. Error bars indicate standard error. d Comparison of tumor single-cell clusters before (left) and after castration (right). Cell clusters are depicted using different colors as indicated on top of the figure panel. e Violin plot shows an increase in pseudotime of individual cells within the cell clusters after castration. To deal with drop-out events, the pseudotime inference was performed for each cell following imputation of missing genes using RMagic88. Pre-castration (Pre-CX): red; post castration (Post-CX): blue. f Gene sets perturbed in LuCaP-147 xenografts’ single-cell clusters at regrowth (post castration) compared to pre-castration. Most hallmark gene sets are upregulated (red) or downregulated (blue) similarly. A marked downregulation of AR-responsive genes is noted. Differential expression for each cluster denoting the transcriptional changes occurring after castration was determined using the MAST algorithm91. Subsequently, we determined the gene-set enrichments using Camera (pre-ranked)75. g Dimensionality reduction (UMAP) of murine macrophages (green) pre-castration (left) and post castration (right) highlights a notable increase in macrophage count at regrowth. h After castration, the percentage of infiltrated macrophage to tumor cell ratio increases. Pre-CX (red): 8.1%; post-CX (regrowth, blue): 17.1%. Statistical significance was computed using Pearson’s χ2 test. See Source data file. i After castration, macrophages display more M2-like transcriptional features according to the macrophage polarization index, as determined by using MacSpectrum78. Significance levels (P values) were determined using Wilcoxon’s rank-sum text (two-tailed). Pre-CX: red; post-CX (Regrowth): blue. See Source data file. j Single samples gene-set enrichment analysis of inflammation-related pathways performed following reclustering of murine macrophages extracted from the corresponding single-cell RNA-seq experiments. Missing gene-expression values (drop-out events) for each cell were imputed using RMagic. With increasing pseudotime along the trajectory, macrophages of xenograft models display less active TNFA (dark gray) and inflammatory signaling (light gray). PNPCa xenografts were excluded from the analysis because of the limited number of infiltrated macrophages. Error bars indicate standard error.

