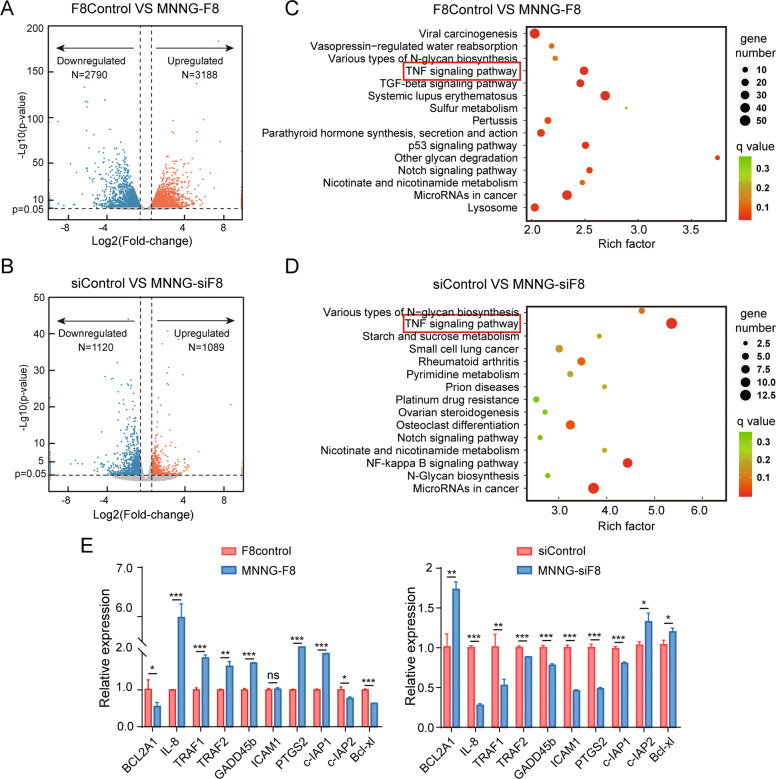
Fig. 4. Transcriptome analysis of FUT8-overexpressing MNNG-F8 and FUT8-under-expressing MNNG-siF8 cells and their control cells.
A, B Volcano plots show the differentially expressed genes (DEGs) between the two FUT8-regulated cells and their controls. Fold-change values on the abscissa were log2-transformed, and P values on the ordinate were -log10 transformed. The selection criteria of differential expressed genes (DEG) was P-value < 0.05 and changed expression higher than 1.5 or lower than 0.67 fold. C, D KEGG pathway enrichment analysis for DEGs between the two FUT8-regulated cells and their controls. E Mean ± SD (N = 3) relative expression of DEGs. Among the DEGs, genes that are highly related to the TNF/NF-κB2 pathway were verified by RT-qPCR to be expressed in the FUT8-altered cells and their controls. ns På 0.05; *P < 0.05; **P < 0.01; ***P < 0.001.

