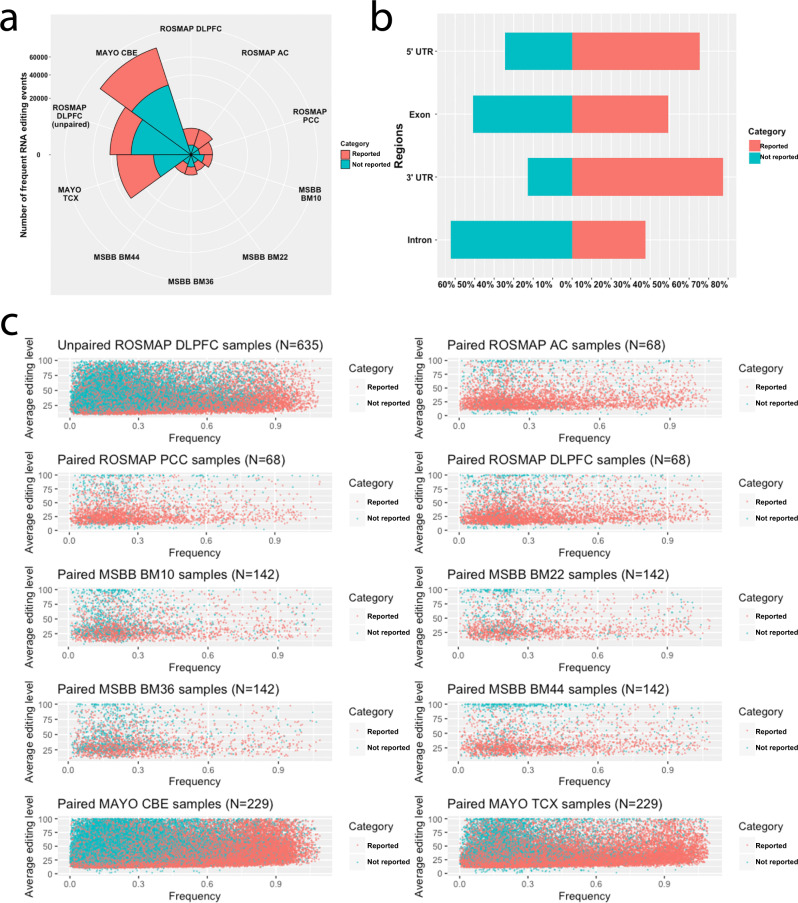
Fig. 2. Comparisons of the reported and not reported frequent RNA editing events.
a Nightingale plot presents the number of “not reported” and “reported” frequent editing events and their relative proportions within each dataset. b Regional distributions of frequent “not reported” and “reported” RNA editing events. c Scatter plots of the average level (% of alternative reads over all reads) vs. their frequency of “not reported” and “reported” RNA editing events within each dataset. The color coding for all the plots are red for “reported” and blue for “not reported” frequent RNA editing event.

