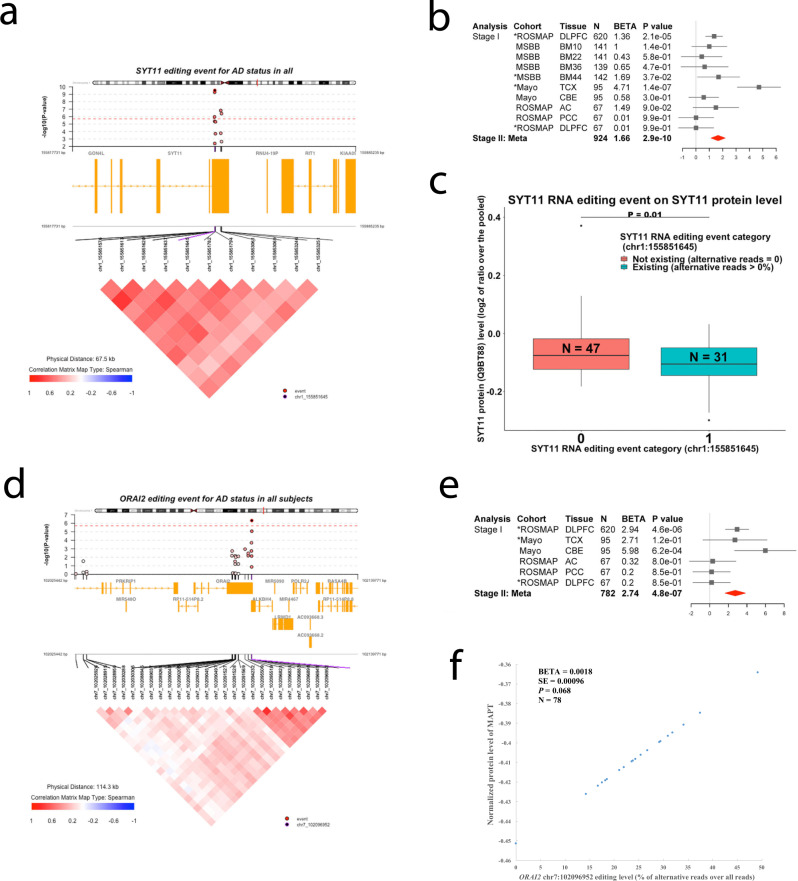
Fig. 6. Regional, forest, functional and pathway plots of SYT11 and ORAI2 RNA editing event.
a, d Regional plot shows the Stage I association results (upper). Each circle represents a frequent RNA editing event with the top one in purple. The correlation (r) between the top one and the others are shown with the color coding of: shallow to dark red for 0 < r ≤ 1, white for r = 0, and shallow to dark blue for −1 ≤ r < 0. The correlation matrix between each pair is shown in a triangle (lower) with the same color coding. (b, e) Forest plot shows results in each dataset and Stage II meta-analyzed results. The estimated difference in the mean level of RNA editing (% alternative reads) by clinical AD status (0 for normal controls, 1 for mild cognitive impairment, and 2 for AD) and its 95% confidence interval were illustrated by the filled square and horizontal line for each dataset or the filled red diamonds for the summaries. The displayed P values were not adjusted by the multiple testings and were derived by two-sided tests. c Association between RNA editing event with protein expression at SYT11. The distributions of RNA editing level by different groups are represented by boxplots where the minimum and the maximum values are represented by the lowest and highest end of the vertical line passing the center of the box, and the first quartile (25%), the median (50%), and the third quartile (75%) of the values are represented as the lower, center, and higher horizontal lines of the box. f Association between RNA editing event with protein expression at MAPT was represented by the scatter plot where each dot represents one subject included in the analysis. The X axis represents the RNA editing level at ORAI2 (% alternative reads out of the total reads) and the Y axis represents the predicted normalized protein level of MAPT by the generalized linear regression line of the effect of the ORAI2 RNA editing (exposure variable) on the normalized protein level of MAPT (outcome variable) with the adjustments of the covariates of age at death, sex, postmortem interval and RIN score. The displayed P values were not adjusted by the multiple testings and were derived by two-sided tests. Abbreviations: N, number of subjects; BETA, regression coefficient; SE, standard error; P, P value; AD, Alzheimer’s disease.

