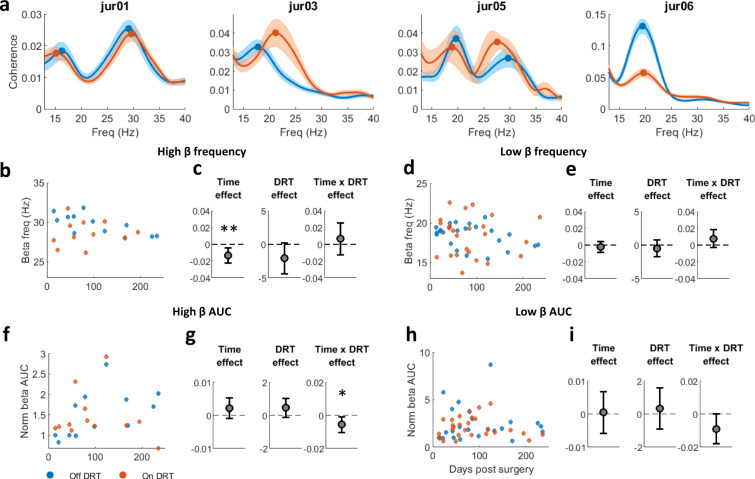
Fig. 8. Dopamine modulation shifts beta-frequency of interhemispheric STN LFP coherence in patients with PD.
a Magnitude-squared coherence (mean ± STE) off (blue) and on (red) dopamine-replacement therapy (DRT) in each patient. b, d Frequency of beta-coherence peak in the high (b)/low (d) beta-domains as function of time post-surgery. Each point represents average per day of beta-coherence peak-frequency on (red) and off (blue) DRT. Right: Time, DRT, and interaction effects on beta-coherence peak-frequency estimated by a mixed linear effect model (MLEM), constructed for N = 124 and 205 independent interhemispheric electrode pairs for high-beta frequency (c) and low-beta frequency (e) models, respectively. Only pairs with significant beta peak were included in the model. Time (p = 0.005) had significant effect on high-beta coherence peak-frequency. Gray circles indicate each factor’s coefficient in the model, and whiskers indicate confidence intervals. Positive and negative coefficients indicate positive and negative linear relationship, respectively. In the interaction effect, the coefficient presented is of time given on DRT condition. f–i Time and DRT effects on beta synchrony in the high (f, g)/low (h, i) beta-domains. Plot conventions same as b–e. Beta synchrony is evaluated as baseline-corrected area under the curve (AUC) of the coherence in the high (f, g) and low (h, i) beta-domains. MLEM was constructed for N = 204 and 480 independent interhemispheric electrode pairs for high-beta AUC (g) and low-beta AUC (i) models, respectively. Time*DRT interaction had significant effect on high-beta synchrony (p = 0.0185). Significance of the fixed effects was estimated with ANOVA test (Table-S13). Source data are provided as a Source Data file. *p < 0.05, **p < 0.01, ***p < 0.001.

