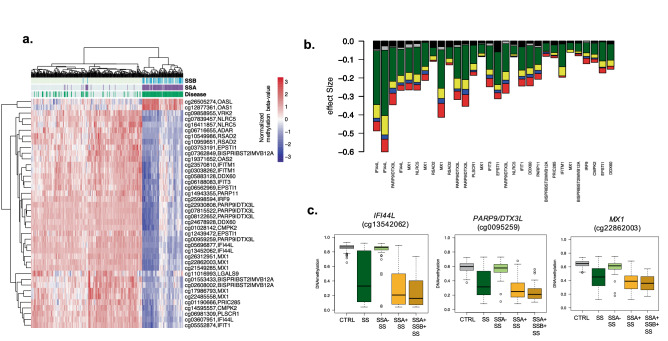
Figure 2.
Effect of Autoantibody profile in SS-associated epigenetic signals. (a) Hierarchical clustering representation from SS patients and healthy individuals (in columns) accordingly to DNA methylation levels (in rows) at the top SS-associated CpG sites. Subjects are classified according to disease status (green) and the presence of Anti-Ro/SSA (purple) and Anti-La/SSB (light blue) autoantibodies. (b) Barplot representing the effect sizes obtained in different models where DNA methylation was contrasting between different SS patients (according to autoantibody profiles). Black bar is a model that contrasted SSA- SS patients with CTRLs. Grey bar is a model that included all SS patients and was adjusted by SSA. Green bar is a model that included all SS patients and was unadjusted by SSA. Yellow line is a model that compared SSA + SS patients and CTRL. Blue line is a model that contrasted SSA + patients with CTRLs adjusted by SSB. Red bar is a model that contrasted SSA + SSB + patients and CTRLs. (c) Boxplots representing DNA methylation differences across different groups in three selected genes. R software73 and Adobe Illustrator (https://www.adobe.com/) was used to create figures.

