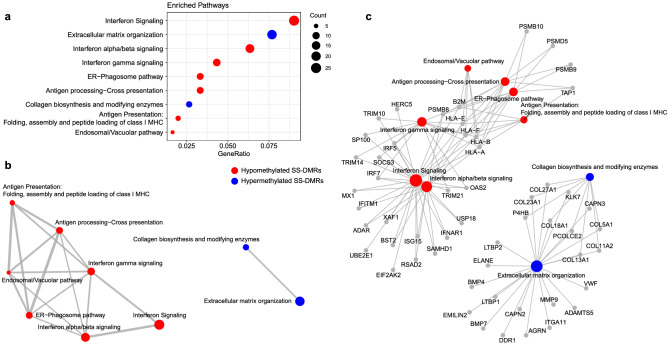
Figure 3.
Functional Enrichment Results for differentially methylated regions based in Reactome database. (a) Dotplot representing Reactome functional pathways that are enriched in differentially methylated regions. Only significant pathways (adjusted P < 0.05) that are represented by more than 5 genes are illustrated. (b) Enrichment map that organizes significant enriched terms into a network with edges connecting overlapping gene sets. (c) Genes that are involved in significant terms are connected by linkages. Pathways in red are enriched in hypomethylated genes while pathways in blue are enriched in hypermethylated genes. Dot size represents number of genes with DMRs per pathways. R software73 and Adobe Illustrator (https://www.adobe.com/) was used to create figures.

