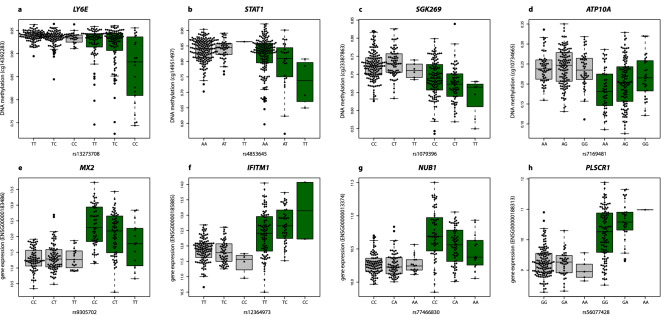
Figure 5.
Disease interacting QTLs (a) The minor C-allele of SNP rs13273708 is associated with a decrease in DNA methylation levels at LY6E gene only in SS patients (ßSS.meQTL = − 0.018, PSS.meQTL = 6 × 10–04), but not in the healthy population (PSS.meQTL > 0.05). (b) The minor A-allele of SNP rs902834 decreases the DNA methylation level at STAT1 only in SS patients (ßSS.meQTL = − 0.024, PSS.meQTL = 0.0012), and not the healthy population (PCTRL.meQTL > 0.05). (c) The minor T-allele of rs1079396 is associated with SGK269-methylation in SS patients (ßSS.meQTL = -0.017, PSS.meQTL = 0.0119), but not in the healthy population (PCTRL.meQTL > 0.05). (d) The minor G-allele of rs7169481 in ATP10A is associated with increased DNA methylation at ATP10A in SS patients (ßSS.meQTL = 0.018, PSS.meQTL = 0.0047). However, in the healthy population this allele has no significant effect (PCTRL.meQTL > 0.05). (e) The minor T-allele of the rs9305702 genetic variant is associated with a decreased MX2 gene expression in SS patients (ßSS.eQTL = − 0.302, PSS.eQTL = 1.8 × 10–04), and shows no evidence of association in the healthy population (PCTRL.eQTL > 0.05). (f) The minor C-allele of rs12364973 is associated with an increased IFITM1 gene expression in SS patients (ßSS.eQTL = 0.28, PSS.eQTL = 0.012) and shows no evidence of association in the healthy population (PCTRL.eQTL > 0.05). (g) In SS patients, NUBI expression decreases with the dose of the minor A-allele of rs77466830 (ßSS.eQTL = − 0.15, PSS.eQTL = 3.5 × 10–04); however, in the healthy population it remains stable (PCTRL.eQTL > 0.05). (h) In SS patients, PLSCR1 expression increased with the dose of the minor A-allele of rs56077428 (ßSS.eQTL = 0.357, PSS.eQTL = 0.0208); however, in the healthy population it remains stable (PCTRL.eQTL > 0.05). Green boxplots represent SS population, while grey boxplots represent the healthy control population. DNA methylation is quantified with β-values, gene expression is at the logarithmic scale. R software73 and Adobe Illustrator (https://www.adobe.com/) was used to create figures.

