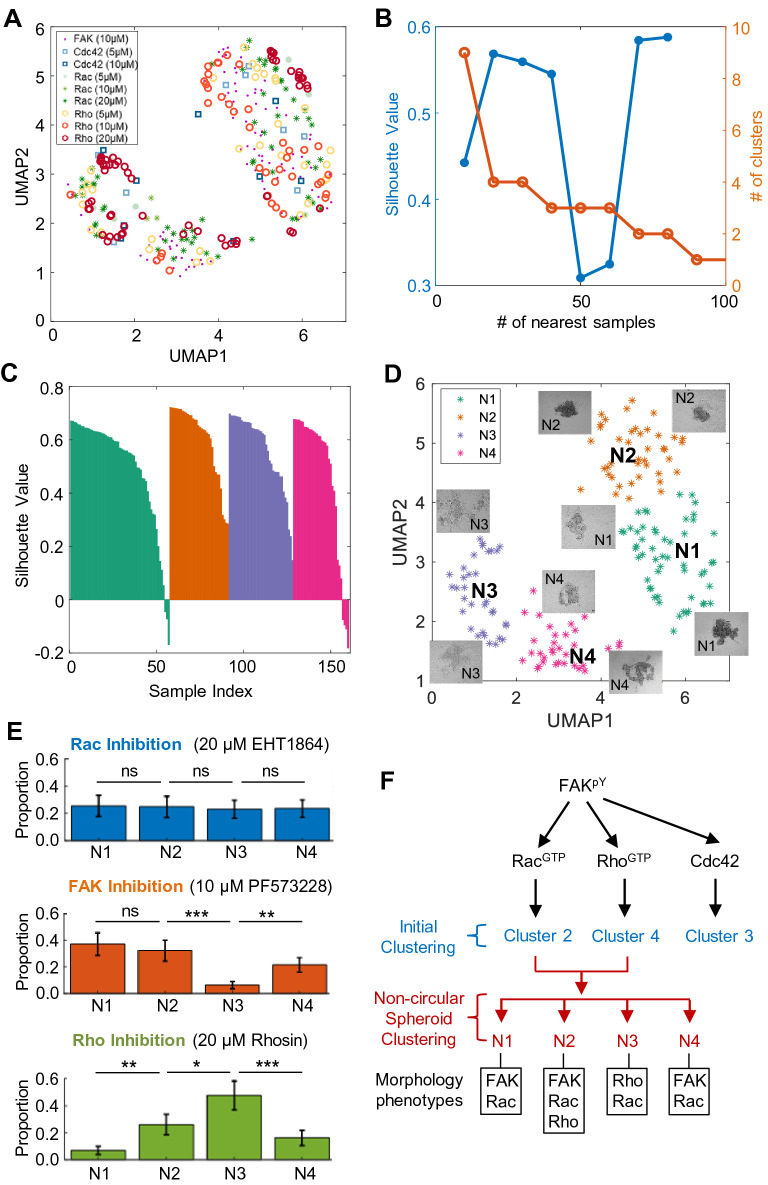
Figure 6.
Clustering analysis of noncircular spheroids and the presence of distinct clusters with disrupted morphologies. (A) Fifteen morphological features extracted from human VSMC spheroid images from Clusters #2 and #4 were visualized on UMAP plots. The different colored markers are used to represent the various drug treatments. (B) The number of nearest samples between 10 and 100 was evaluated on the training set, and the silhouette values were plotted. A cluster number of 4 was selected. (C) The silhouette values and the number of clusters on the training set were evaluated by varying the number of nearest samples. (D) Four morphological clusters were observed in the testing set based on the noncircular spheroids from Clusters #2 and #4 obtained from Fig. 5. The different colored markers are used to represent the various morphological clusters. (E) Average Proportionality plots of the distribution of VSMC spheroids in each morphological cluster from the repeated random splitting of training and testing sets. Only testing sets were used. *p < 0.05, **p < 0.01, ***p < 0.001, and ns not significant. (F) Summary of the clustering analysis results.

