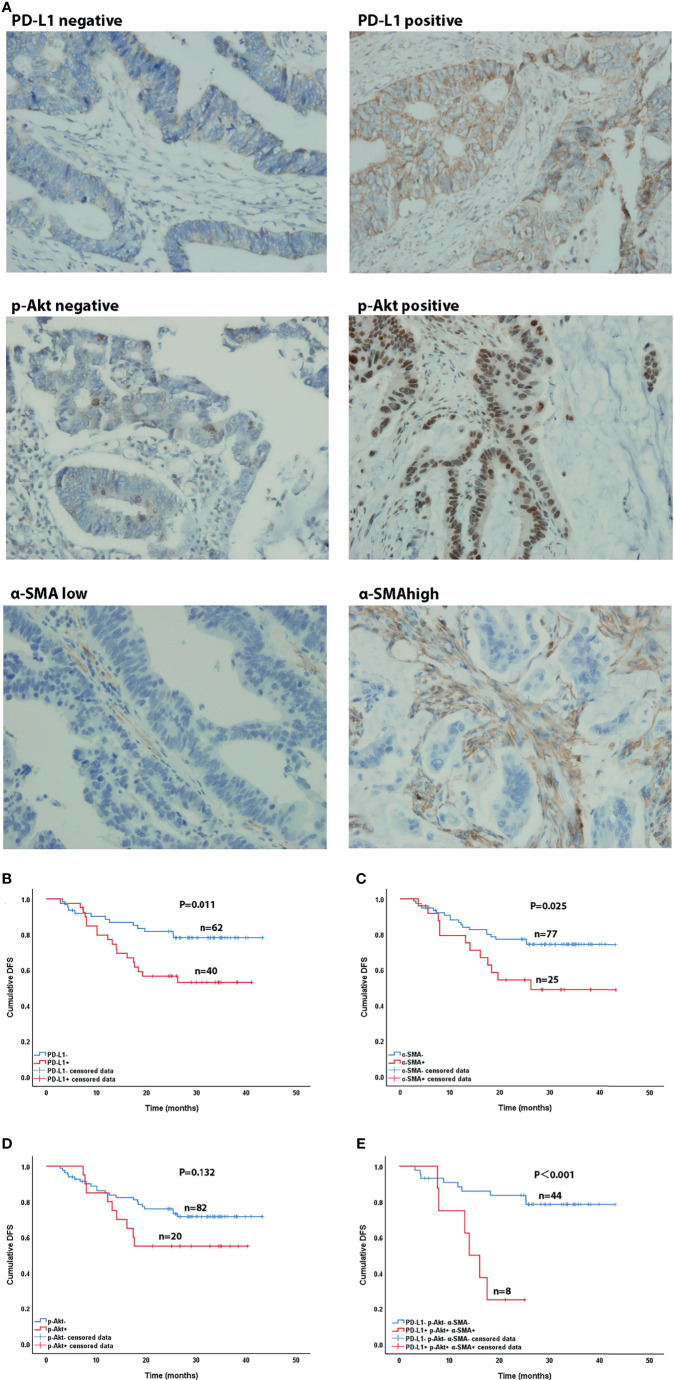
Figure 4.
Immunohistochemical (×400) and Kaplan-Meier curves of CRC patients. (A) Immunohistochemical staining of PD-L1, p-AKT and α-SMA expression. (B–D) Effect of PD-L1 expression (B), p-AKT expression (C), and α-SMA high expression (D) on DFS in CRC patients. (E) Effect of co-expression of PD-L1, p-AKT and α-SMA high and triple-negative expression on DFS in CRC patients.

