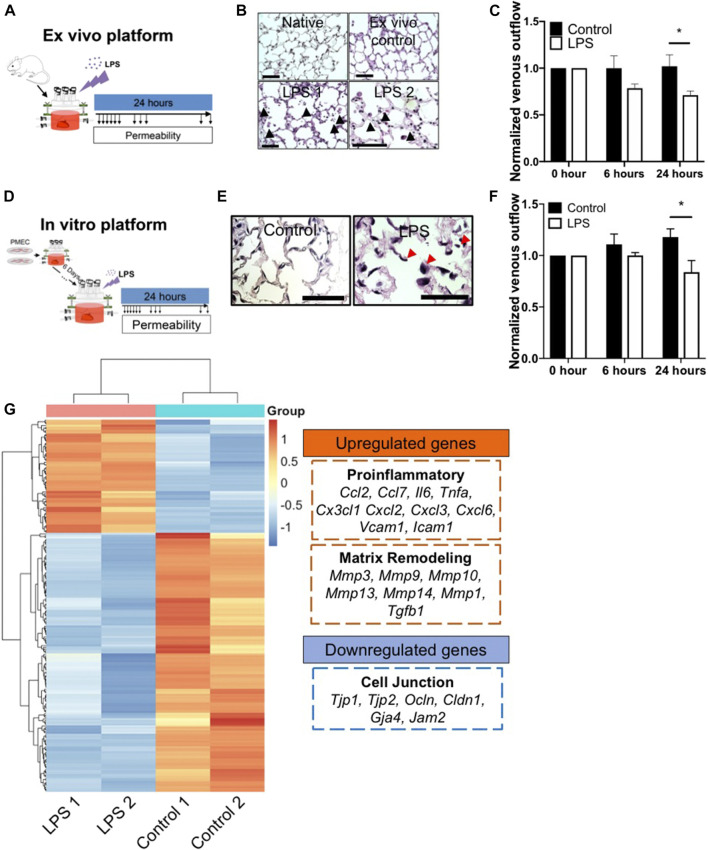
FIGURE 6.
The ex vivo and in vitro platform to model LPS-induced inflammation. (A) Schematic of workflow for the ex vivo platform. (B) Representative H/E images of lung tissues from native, ex vivo control, and ex vivo LPS samples. Arrows indicate cell death, matrix breakdown, and interstitial puffing. Scale bar indicate 75 μm. (C) Venous outflows in the ex vivo platform with or without LPS treatment, n = 3. (D) Schematic of workflow for the in vitro platform. (E) Representative H/E images of lung tissues from control and LPS-treated repopulated lungs. Arrows indicate cell detachment and occlusion in the pulmonary vasculature. Scale bar indicate 75 μm. (F) Venous outflows in the repopulated lung control, and repopulated lung LPS conditions, versus time, n = 3. (G) Heatmap of top differentially (adjusted p < 0.05 and log2foldchange >3 or <−3) expressed genes between control and LPS-treated repopulated lungs, normalized across each gene to show up-regulation (red) and down-regulation (blue) as compared to the other group. The representative upregulated and downregulated genes after LPS treatment as compared to control without LPS were listed. * indicate p < 0.05. There were 3–4 replicates performed in each sample.

