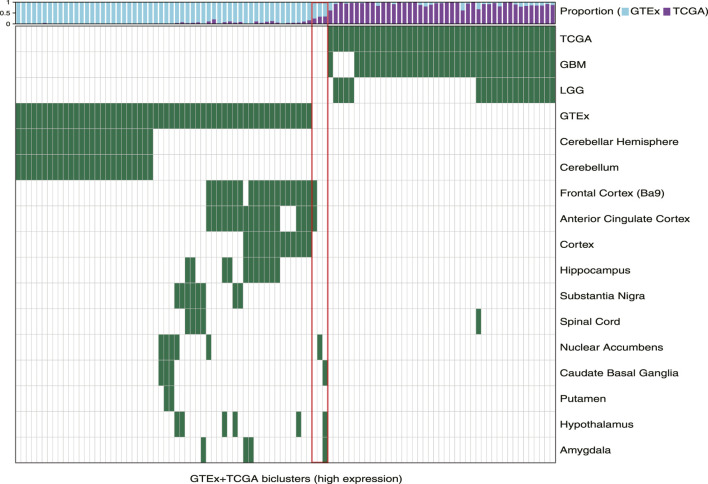
FIGURE 1.
Biclusters from TuBA’s high expression analysis, either enriched in the GTEx normal tissue collected from different brain regions or enriched in the TCGA tumors with LGG or GBM subtypes. The bars show the proportion of GTEx vs. TCGA samples in each bicluster. The red box highlights the three biclusters with enrichment in neither TCGA nor GTEx samples, including the cilium bicluster (most left) with enrichment in amygdala, hypothalamus, and caudate normal tissue.

