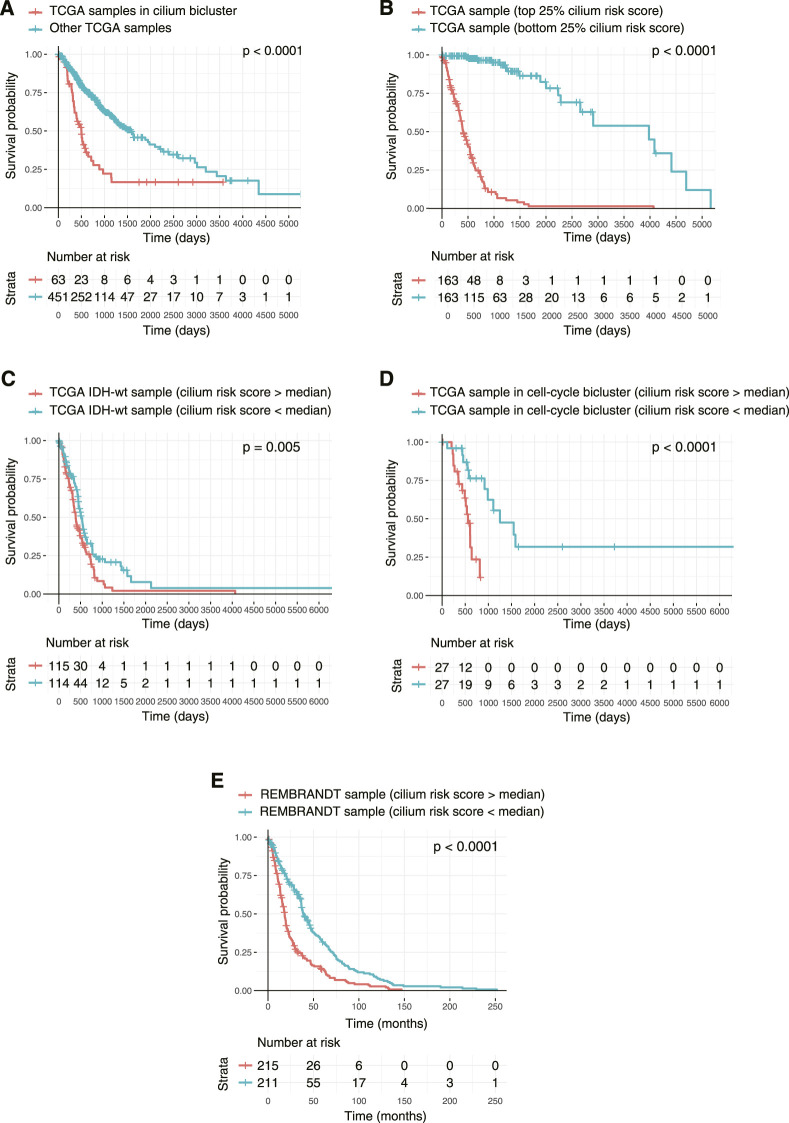
FIGURE 8.
Kaplan-Meier survival analysis of TCGA tumors based on their cilium expression. (A) Patients with TCGA tumors in the cilium bicluster had worse overall survival (OS) compared to other patients. (B) Patients with tumors in the top 25% cilium risk score had poorer OS compared to patients with tumors in the bottom 25% cilium risk score. (C) Patients with IDH1/2 wild-type gliomas with cilium risk scores below the population’s median had poorer OS compared to those with scores above the median. (D) Cilium risk score stratified patient OS in biclusters associated with poor prognosis, including a bicluster enriched in cell cycle. (E) Cilium risk score was reproducibly predictive of OS for patients in the independent REMBRANDT cohort.

