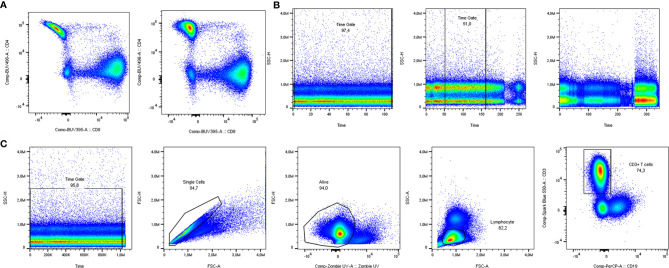
Figure 2.
Manual quality control and data cleaning. (A) Unmixing results using single stain reference controls for CD4 on beads (left) vs. cells (right). (B) Examples of time gates where all cells could be included (left), the best part was included (middle) and a sample was excluded from analysis due to inconsistent flow rate (right). (C) Pregating strategy to include solely clean T cell data in downstream analysis.

