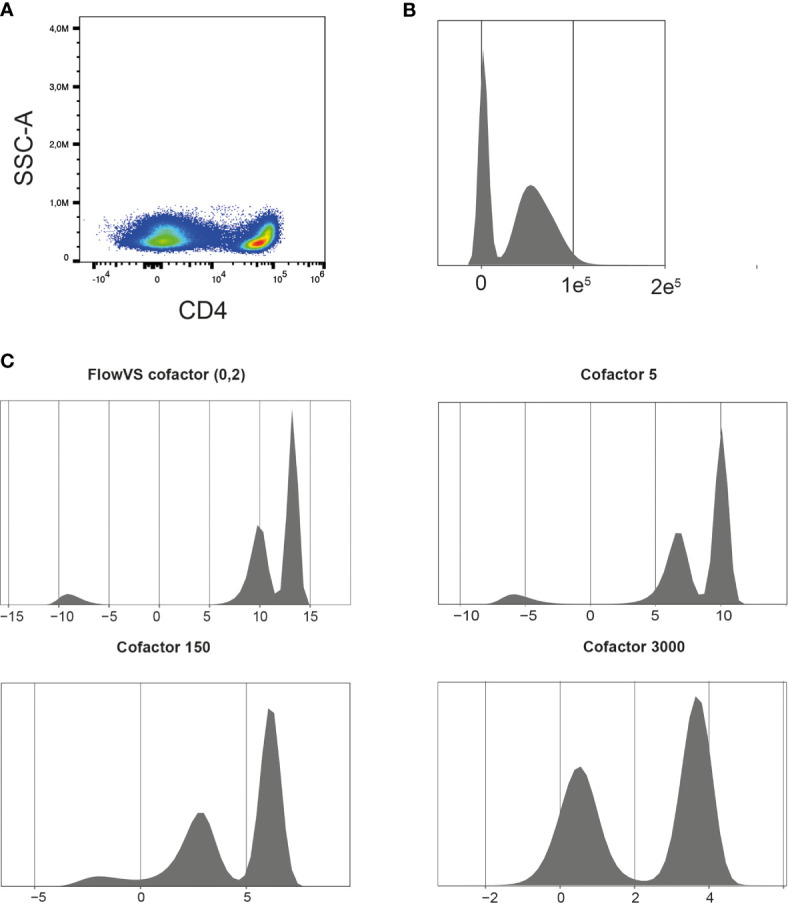
Figure 3.

Finding the right cofactor for arcsinh transformation. (A) Representative CD4 pseudocolor plot. (B) Representative density plot of untransformed CD4 expression. (C) Density plots of CD4 expression after arcsinh transformation with different cofactors. Cells were pre-gated on living CD3+ T cells.
