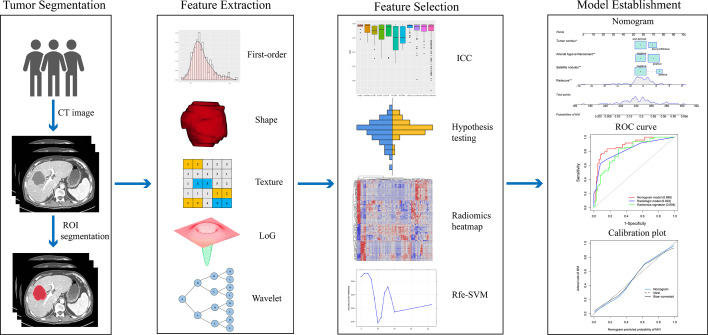
Figure 2.
Workflow for the radiomics process. After CT images were acquired, segmentation of the tumor was performed. The extracted radiomics features include first-order, shape, Laplacian of Gaussian, texture, and wavelet features. A four-step approach was performed for feature dimension reduction. Intra- and inter-class correlation coefficient (ICC) was used to evaluate the reproductivity of features. Values lower than 0.8 were eliminated. Student’s t-test or Mann–Whitney-U test was performed to find the differential radiomics features. A heatmap shows the Pearson correlation coefficients matrix among radiomics features. Rfe-SVM was applied to develop the radiomics signature. A nomogram was constructed by integrating independent radiological predictors and portal phase image radiomics signature. The nomogram and radiologic model’s discriminative ability were compared with the ROC curve analysis and quantified by the AUC. The calibration curve demonstrated good agreement between the actual and nomogram predicted probabilities.

