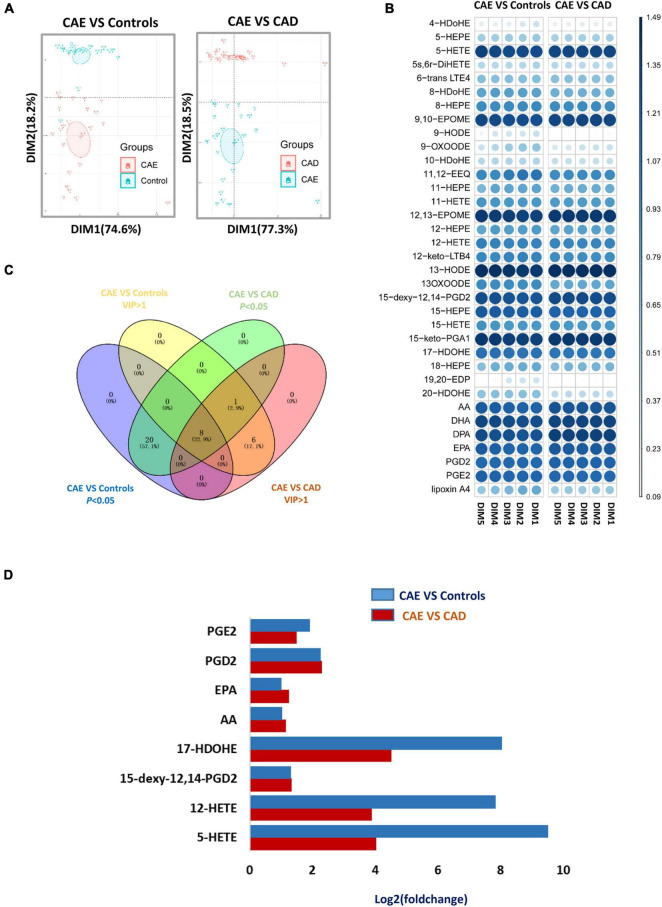
FIGURE 3.
Defining of a potential metabolic biomarker for CAE. (A) Score plot of the first (PC1) and second (PC2) PCs (horizontal and vertical axes, respectively) from principal component analysis of arachidonic acid metabolites in discovery sets. (B) VIP value of metabolites from PCA analysis in discovery sets. (C) Venn diagram shows an overlap between metabolites with VIP value > 1 and P-value < 0.05. (D) Fold change of eight serum metabolites from C in discovery sets. CAE, coronary artery ectasia; PCA, principal component analysis.

