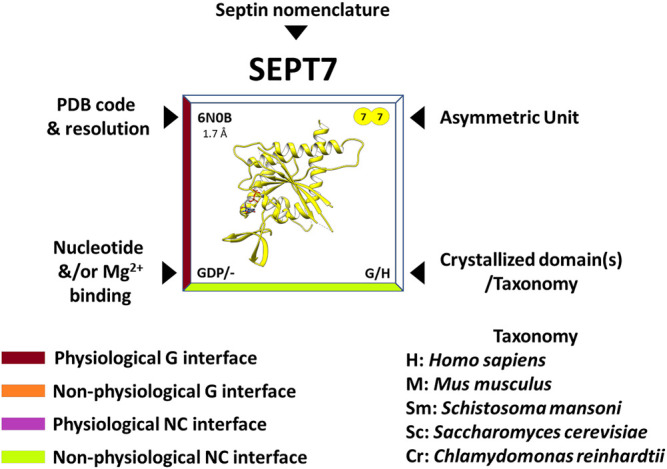
FIGURE 2.

Features of the “Septin Chart” (see complete figure in Supplementary Figure S1). The PDB code and resolution are shown in the upper left corner, the contents of the asymmetric unit in the upper right, the presence and nature of the bound nucleotide/magnesium in the lower left corner and finally, in the lower right, the purified and crystallized domain(s) as well as the acronym of the organism to which it belongs (e.g., H = Homo sapiens). In addition, the edges of the box surrounding the structure are color-coded and refer to the contact interfaces observed in the crystal: burgundy for a physiological G-interface, orange for a non-physiological G-interface, purple for a physiological NC-interface and lime for a non-physiological NC-interface. In some cases, in order to observe some of the interfaces, it is necessary to apply crystallographic symmetry operations to the asymmetric unit.
