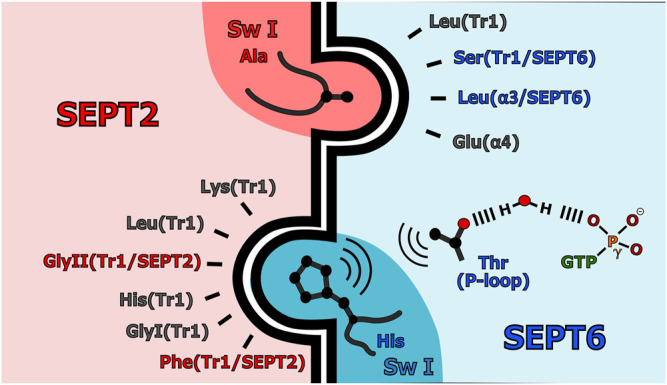
FIGURE 7.

Interaction specificities in the SEPT2-SEPT6 G-interface. Simplified scheme for the heterotypic interface highlighting the importance of residues coming from switch I on both sides of the interface. Group-specific (characteristic) residues are shown colored, in red for SEPT2 and in blue for SEPT6. The network of interactions leading from the interface to the γ-phosphate of the GTP is shown.
