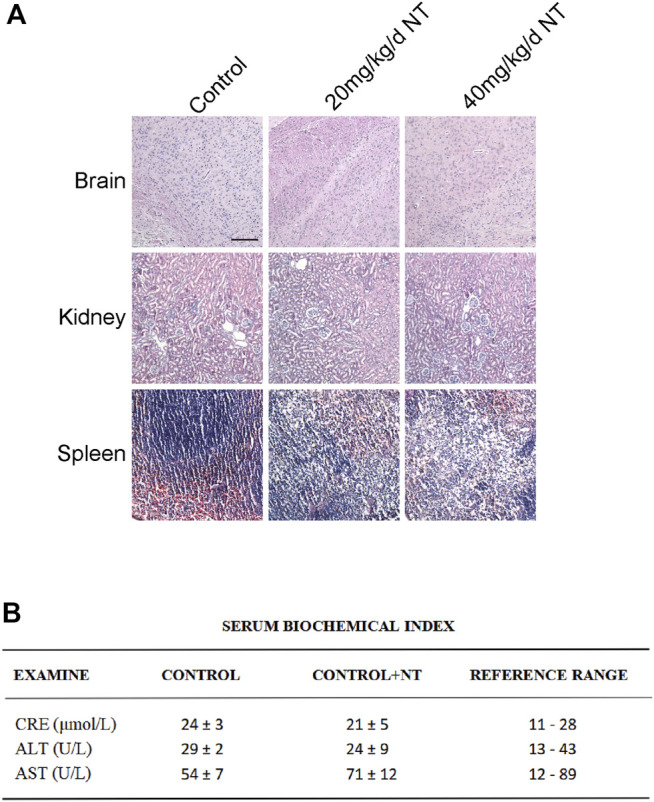
FIGURE 2.

Tissue toxicity verification of NT. (A) H and E staining of the brain, kidneys, and spleen of mice in each group. Magnification: 20X; Scale bar = 100 μm. (B) Blood biochemical test in each group. Data were expressed as mean ± SD, n = 3. n.s. represents no statistical significance.
