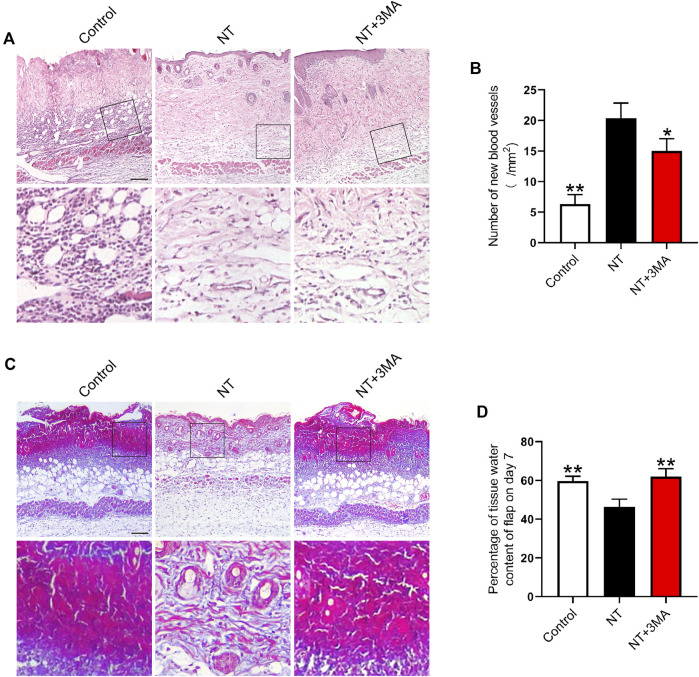
FIGURE 5.
Application of NT results in a better histologic state of the flap. (A) H and E staining images of the control, NT, and NT+3MA groups. Magnification was × 10, Scale bar = 200 μm. Area selected by the white border is taken at high magnification as the representative image, Scale bar = 50 μm. (B) Number of new blood vessels. (C) Masson’s trichrome stain images of each group showing blood vessels and collagen fibers. Scale bar = 200 μm. High-power images were also equipped, Scale bar = 50 μm. (D) Percentage of the tissue water content of the flap on day 7. Data were expressed as mean ± SD, n = 3. “*” and “**” represent p <0.05 or p <0.01 versus the NT group.

