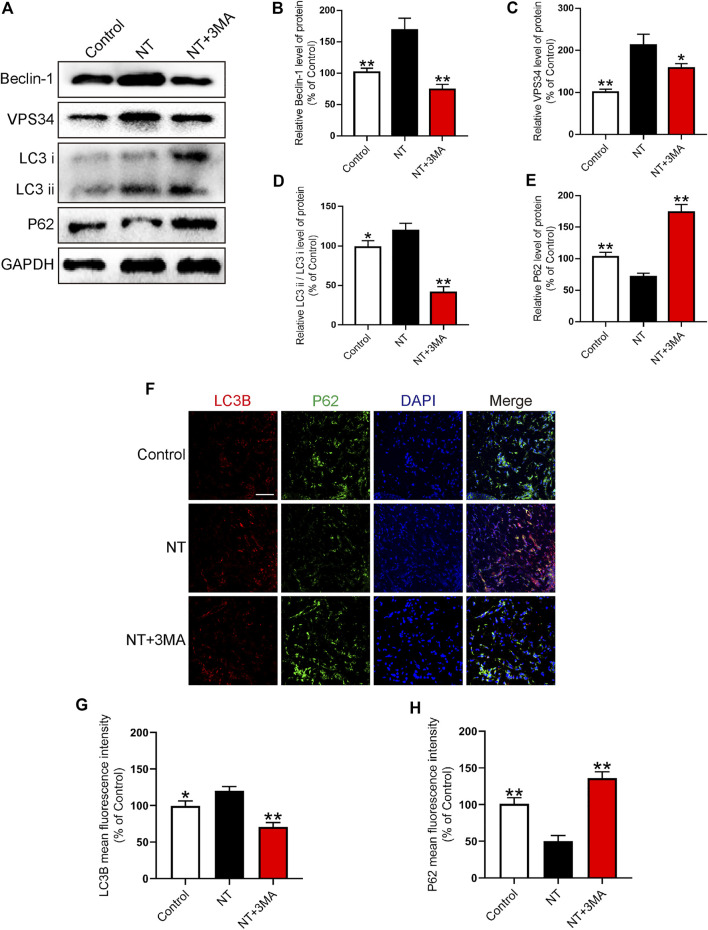
FIGURE 7.
NT improves autophagy levels (A) Western blot results showing the expression of Beclin-1, VPS34, LC3, and P62 in different groups. (B–E) Quantitative analysis of Beclin-1, VPS34, LC3, and P62 protein expressions. (F) Immunofluorescence showing the expression of LC3B (red), P62 (green), and DAPI (blue) in different groups. Magnification: 20X; Scale: 100 μm. (G–H) Mean fluorescence intensity of LC3B and P62 in different groups. Data were expressed as mean ± SD, n = 3. “**” and “*” represent p <0.01 or p <0.05 versus the NT group, indicating statistical significance.

