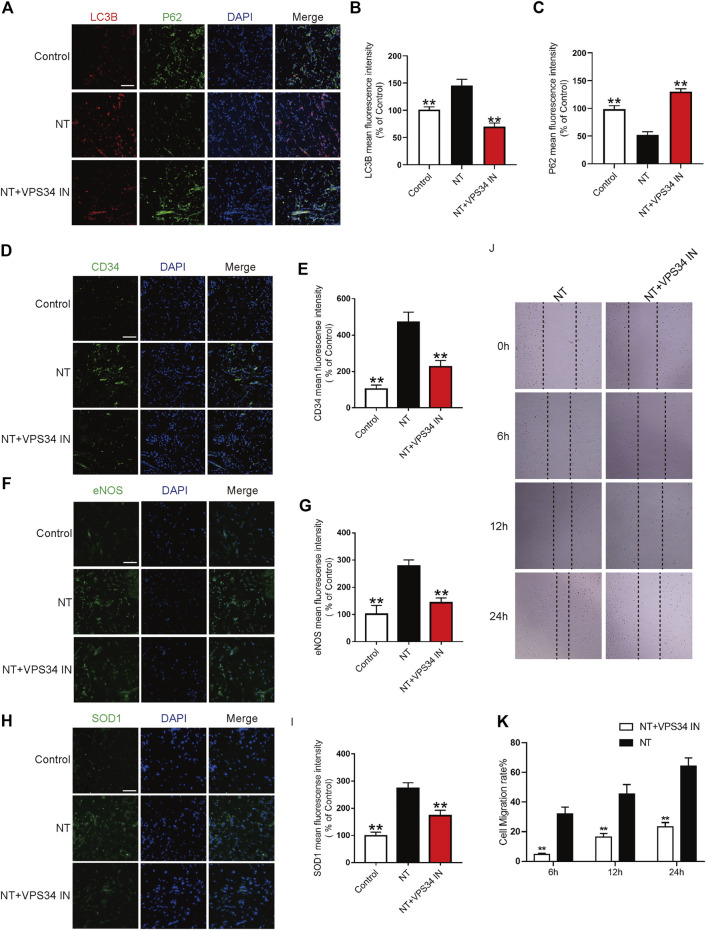
FIGURE 9.
NT regulates autophagy through the Beclin-1/VPS34/LC3 pathway in vitro (A) Immunofluorescence showing the expression of LC3B (red), P62 (green), and DAPI (blue) in different groups. Magnification: 40X; Scale bar: 50 μm. (B–C) Mean fluorescence intensity of LC3B and P62 in different groups. (D) Immunofluorescence showing the expression of CD34 (green) and DAPI (blue) in different groups. Magnification: 40X; Scale bar: 50 μm. (E) Mean fluorescence intensity of CD34 in different groups. (F) Immunofluorescence showing the expression of eNOS (green) and DAPI (blue) in different groups. Magnification: 40X; Scale bar: 50 μm. (G) Mean fluorescence intensity of eNOS in different groups. (H) Immunofluorescence showing the expression of SOD1 (green) and DAPI (blue) in different groups. Magnification: 40X; Scale bar: 50 μm. (I) Mean fluorescence intensity of SOD1 in different groups. (J) Images of wound healing in the NT and NT + VPS34 IN groups. Images were captured at 0, 6, 12, and 24 h after the scratch test. (K) Cell migration rate that was affected by the abovementioned factors for 6, 12, and 24 h. Data were expressed as mean ± SD, n = 3. “**” and “*” represent p <0.01 or p<0.05 versus the NT group, “##” and “#” represent p <0.01 or p <0.05 versus the NT + VPS34 IN group, indicating statistical significance.

